Note
Click here to download the full example code
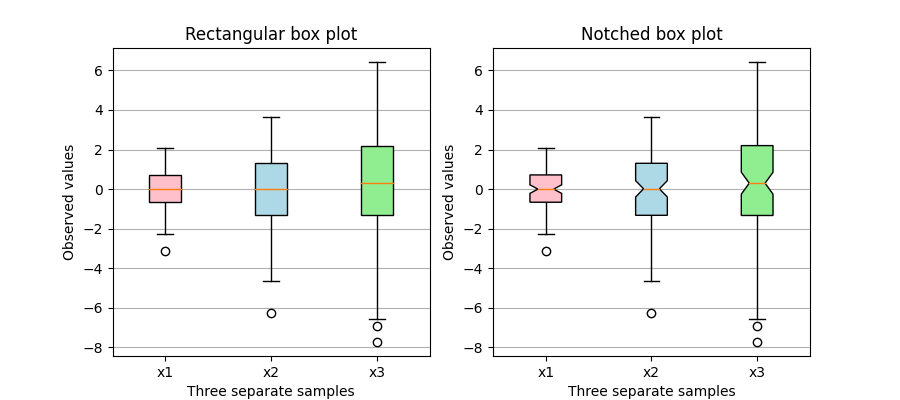
Box plots with custom fill colors
This plot illustrates how to create two types of box plots
(rectangular and notched), and how to fill them with custom
colors by accessing the properties of the artists of the
box plots. Additionally, the labels parameter is used to
provide x-tick labels for each sample.
A good general reference on boxplots and their history can be found here: http://vita.had.co.nz/papers/boxplots.pdf
import matplotlib.pyplot as plt
import numpy as np

# Random test data
np.random.seed(19680801)
all_data = [np.random.normal(0, std, size=100) for std in range(1, 4)]
labels = ['x1', 'x2', 'x3']

fig, (ax1, ax2) = plt.subplots(nrows=1, ncols=2, figsize=(9, 4))

# rectangular box plot
bplot1 = ax1.boxplot(all_data,
                     vert=True,  # vertical box alignment
                     patch_artist=True,  # fill with color
                     labels=labels)  # will be used to label x-ticks
ax1.set_title('Rectangular box plot')

# notch shape box plot
bplot2 = ax2.boxplot(all_data,
                     notch=True,  # notch shape
                     vert=True,  # vertical box alignment
                     patch_artist=True,  # fill with color
                     labels=labels)  # will be used to label x-ticks
ax2.set_title('Notched box plot')

# fill with colors
colors = ['pink', 'lightblue', 'lightgreen']
for bplot in (bplot1, bplot2):
    for patch, color in zip(bplot['boxes'], colors):
        patch.set_facecolor(color)

# adding horizontal grid lines
for ax in [ax1, ax2]:
    ax.yaxis.grid(True)
    ax.set_xlabel('Three separate samples')
    ax.set_ylabel('Observed values')

plt.show()
References
The use of the following functions and methods is shown in this example:
import matplotlib
matplotlib.axes.Axes.boxplot
matplotlib.pyplot.boxplot
Out:
<function boxplot at 0x7f5f32b86ee0>
Keywords: matplotlib code example, codex, python plot, pyplot Gallery generated by Sphinx-Gallery