Note
Click here to download the full example code
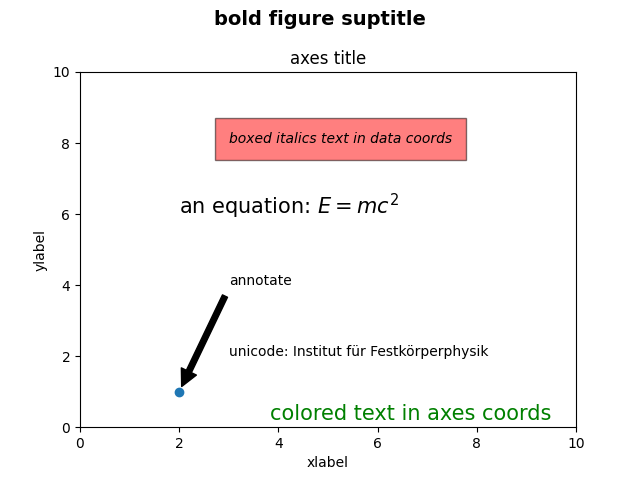
Text Commands
Plotting text of many different kinds.
import matplotlib.pyplot as plt

fig = plt.figure()
fig.suptitle('bold figure suptitle', fontsize=14, fontweight='bold')

ax = fig.add_subplot()
fig.subplots_adjust(top=0.85)
ax.set_title('axes title')

ax.set_xlabel('xlabel')
ax.set_ylabel('ylabel')

ax.text(3, 8, 'boxed italics text in data coords', style='italic',
        bbox={'facecolor': 'red', 'alpha': 0.5, 'pad': 10})

ax.text(2, 6, r'an equation: $E=mc^2$', fontsize=15)

ax.text(3, 2, 'unicode: Institut f\374r Festk\366rperphysik')

ax.text(0.95, 0.01, 'colored text in axes coords',
        verticalalignment='bottom', horizontalalignment='right',
        transform=ax.transAxes,
        color='green', fontsize=15)


ax.plot([2], [1], 'o')
ax.annotate('annotate', xy=(2, 1), xytext=(3, 4),
            arrowprops=dict(facecolor='black', shrink=0.05))

ax.set(xlim=(0, 10), ylim=(0, 10))

plt.show()
References
The use of the following functions, methods, classes and modules is shown in this example:
Out:
<function Axes.annotate at 0x7f5f32c249d0>
Keywords: matplotlib code example, codex, python plot, pyplot Gallery generated by Sphinx-Gallery