Note
Click here to download the full example code
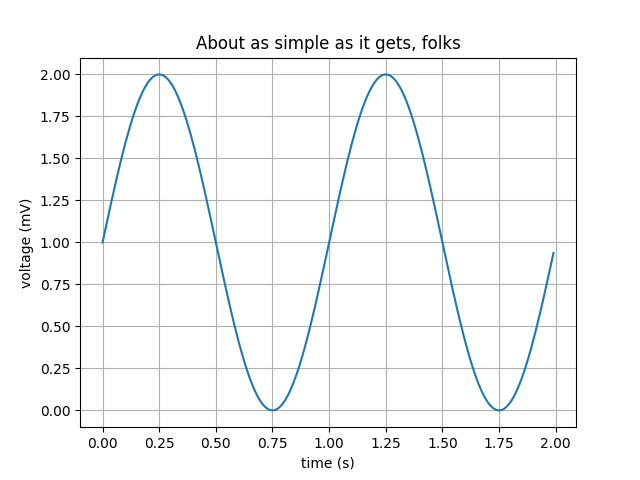
Simple Plot
Create a simple plot.
import matplotlib
import matplotlib.pyplot as plt
import numpy as np

# Data for plotting
t = np.arange(0.0, 2.0, 0.01)
s = 1 + np.sin(2 * np.pi * t)

fig, ax = plt.subplots()
ax.plot(t, s)

ax.set(xlabel='time (s)', ylabel='voltage (mV)',
       title='About as simple as it gets, folks')
ax.grid()

fig.savefig("test.png")
plt.show()
References
The use of the following functions and methods is shown in this example:
Out:
<function Figure.savefig at 0x7f5f32b6e4c0>
Keywords: matplotlib code example, codex, python plot, pyplot Gallery generated by Sphinx-Gallery