Note
Click here to download the full example code
Contour Label Demo
Illustrate some of the more advanced things that one can do with contour labels.
See also the contour demo example.
import matplotlib
import numpy as np
import matplotlib.ticker as ticker
import matplotlib.pyplot as plt
Define our surface
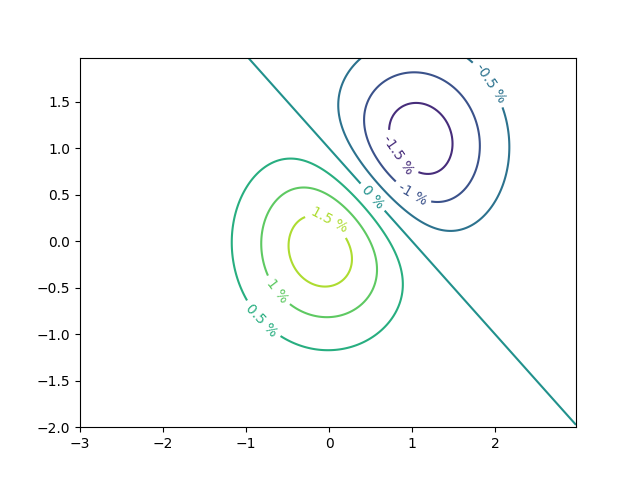
Make contour labels with custom level formatters
# This custom formatter removes trailing zeros, e.g. "1.0" becomes "1", and
# then adds a percent sign.
def fmt(x):
    s = f"{x:.1f}"
    if s.endswith("0"):
        s = f"{x:.0f}"
    return rf"{s} \%" if plt.rcParams["text.usetex"] else f"{s} %"


# Basic contour plot
fig, ax = plt.subplots()
CS = ax.contour(X, Y, Z)

ax.clabel(CS, CS.levels, inline=True, fmt=fmt, fontsize=10)
Out:
<a list of 7 text.Text objects>
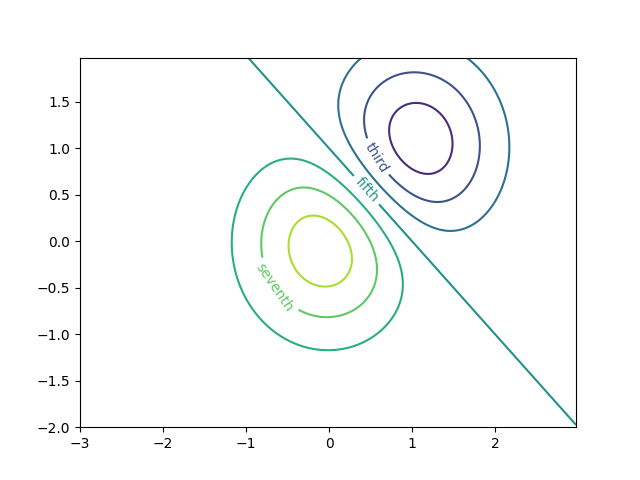
Label contours with arbitrary strings using a dictionary
fig1, ax1 = plt.subplots()

# Basic contour plot
CS1 = ax1.contour(X, Y, Z)

fmt = {}
strs = ['first', 'second', 'third', 'fourth', 'fifth', 'sixth', 'seventh']
for l, s in zip(CS1.levels, strs):
    fmt[l] = s

# Label every other level using strings
ax1.clabel(CS1, CS1.levels[::2], inline=True, fmt=fmt, fontsize=10)
Out:
<a list of 3 text.Text objects>
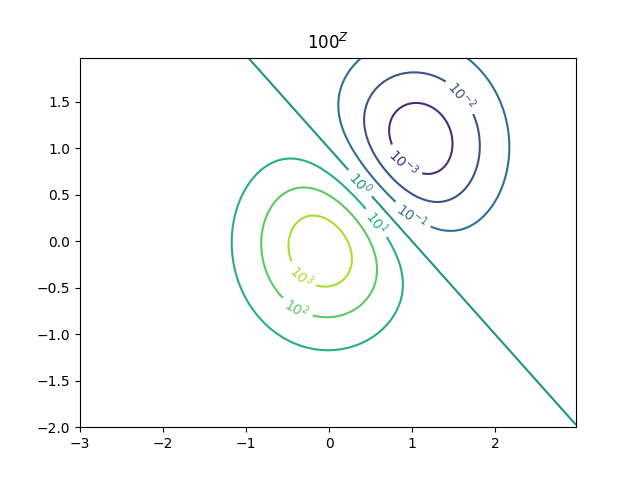
Use a Formatter
fig2, ax2 = plt.subplots()

CS2 = ax2.contour(X, Y, 100**Z, locator=plt.LogLocator())
fmt = ticker.LogFormatterMathtext()
fmt.create_dummy_axis()
ax2.clabel(CS2, CS2.levels, fmt=fmt)
ax2.set_title("$100^Z$")

plt.show()
References
The use of the following functions, methods and classes is shown in this example:
Out:
<function TickHelper.create_dummy_axis at 0x7f5f3e761e50>
Total running time of the script: ( 0 minutes 1.250 seconds)
Keywords: matplotlib code example, codex, python plot, pyplot Gallery generated by Sphinx-Gallery