matplotlib.axes.Axes.axvspan
-
Axes.axvspan(self, xmin, xmax, ymin=0, ymax=1, **kwargs)[source]¶ Add a vertical span (rectangle) across the Axes.
The rectangle spans from xmin to xmax horizontally, and, by default, the whole y-axis vertically. The y-span can be set using ymin (default: 0) and ymax (default: 1) which are in axis units; e.g.
ymin = 0.5always refers to the middle of the y-axis regardless of the limits set byset_ylim.Parameters: - xminfloat
Lower x-coordinate of the span, in data units.
- xmaxfloat
Upper x-coordinate of the span, in data units.
- yminfloat, default: 0
Lower y-coordinate of the span, in y-axis units (0-1).
- ymaxfloat, default: 1
Upper y-coordinate of the span, in y-axis units (0-1).
Returns: PolygonVertical span (rectangle) from (xmin, ymin) to (xmax, ymax).
Other Parameters: - **kwargs
Polygonproperties Property Description agg_filtera filter function, which takes a (m, n, 3) float array and a dpi value, and returns a (m, n, 3) array alphascalar or None animatedbool antialiasedor aaunknown capstyleCapStyleor {'butt', 'projecting', 'round'}clip_boxBboxclip_onbool clip_pathPatch or (Path, Transform) or None colorcolor containsunknown edgecoloror eccolor or None or 'auto' facecoloror fccolor or None figureFigurefillbool gidstr hatch{'/', '\', '|', '-', '+', 'x', 'o', 'O', '.', '*'} in_layoutbool joinstyleJoinStyleor {'miter', 'round', 'bevel'}labelobject linestyleor ls{'-', '--', '-.', ':', '', (offset, on-off-seq), ...} linewidthor lwfloat or None path_effectsAbstractPathEffectpickerNone or bool or float or callable rasterizedbool sketch_params(scale: float, length: float, randomness: float) snapbool or None transformTransformurlstr visiblebool zorderfloat
See also
axhspan- Add a horizontal span across the Axes.
Examples
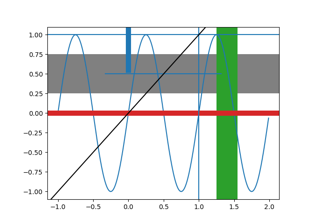
Draw a vertical, green, translucent rectangle from x = 1.25 to x = 1.55 that spans the yrange of the Axes.
>>> axvspan(1.25, 1.55, facecolor='g', alpha=0.5)