mpl_toolkits.axes_grid1.anchored_artists.AnchoredSizeBar
-
class
mpl_toolkits.axes_grid1.anchored_artists.AnchoredSizeBar(transform, size, label, loc, pad=0.1, borderpad=0.1, sep=2, frameon=True, size_vertical=0, color='black', label_top=False, fontproperties=None, fill_bar=None, **kwargs)[source]¶ Bases:
matplotlib.offsetbox.AnchoredOffsetboxDraw a horizontal scale bar with a center-aligned label underneath.
Parameters: - transform
matplotlib.transforms.Transform The transformation object for the coordinate system in use, i.e.,
matplotlib.axes.Axes.transData.- sizefloat
Horizontal length of the size bar, given in coordinates of transform.
- labelstr
Label to display.
- locint
Location of this size bar. Valid location codes are:
'upper right'  : 1,
'upper left'   : 2,
'lower left'   : 3,
'lower right'  : 4,
'right'        : 5,
'center left'  : 6,
'center right' : 7,
'lower center' : 8,
'upper center' : 9,
'center'       : 10
- padfloat, default: 0.1
Padding around the label and size bar, in fraction of the font size.
- borderpadfloat, default: 0.1
Border padding, in fraction of the font size.
- sepfloat, default: 2
Separation between the label and the size bar, in points.
- frameonbool, default: True
If True, draw a box around the horizontal bar and label.
- size_verticalfloat, default: 0
Vertical length of the size bar, given in coordinates of transform.
- colorstr, default: 'black'
Color for the size bar and label.
- label_topbool, default: False
If True, the label will be over the size bar.
- fontproperties
matplotlib.font_manager.FontProperties, optional Font properties for the label text.
- fill_barbool, optional
If True and if size_vertical is nonzero, the size bar will be filled in with the color specified by the size bar. Defaults to True if
size_verticalis greater than zero and False otherwise.- **kwargs
Keyworded arguments to pass to
matplotlib.offsetbox.AnchoredOffsetbox.
Notes
If prop is passed as a keyworded argument, but fontproperties is not, then prop is be assumed to be the intended fontproperties. Using both prop and fontproperties is not supported.
Examples
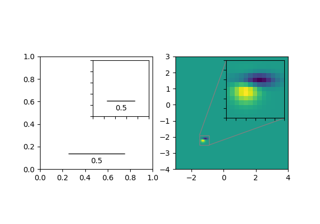
>>> import matplotlib.pyplot as plt
>>> import numpy as np
>>> from mpl_toolkits.axes_grid1.anchored_artists import (
...     AnchoredSizeBar)
>>> fig, ax = plt.subplots()
>>> ax.imshow(np.random.random((10, 10)))
>>> bar = AnchoredSizeBar(ax.transData, 3, '3 data units', 4)
>>> ax.add_artist(bar)
>>> fig.show()
Using all the optional parameters
>>> import matplotlib.font_manager as fm
>>> fontprops = fm.FontProperties(size=14, family='monospace')
>>> bar = AnchoredSizeBar(ax.transData, 3, '3 units', 4, pad=0.5,
...                       sep=5, borderpad=0.5, frameon=False,
...                       size_vertical=0.5, color='white',
...                       fontproperties=fontprops)
Attributes: - size_bar
matplotlib.offsetbox.AuxTransformBox Container for the size bar.
- txt_label
matplotlib.offsetbox.TextArea Container for the label of the size bar.
-
__init__(self, transform, size, label, loc, pad=0.1, borderpad=0.1, sep=2, frameon=True, size_vertical=0, color='black', label_top=False, fontproperties=None, fill_bar=None, **kwargs)[source]¶ Draw a horizontal scale bar with a center-aligned label underneath.
Parameters: - transform
matplotlib.transforms.Transform The transformation object for the coordinate system in use, i.e.,
matplotlib.axes.Axes.transData.- sizefloat
Horizontal length of the size bar, given in coordinates of transform.
- labelstr
Label to display.
- locint
Location of this size bar. Valid location codes are:
'upper right'  : 1,
'upper left'   : 2,
'lower left'   : 3,
'lower right'  : 4,
'right'        : 5,
'center left'  : 6,
'center right' : 7,
'lower center' : 8,
'upper center' : 9,
'center'       : 10
- padfloat, default: 0.1
Padding around the label and size bar, in fraction of the font size.
- borderpadfloat, default: 0.1
Border padding, in fraction of the font size.
- sepfloat, default: 2
Separation between the label and the size bar, in points.
- frameonbool, default: True
If True, draw a box around the horizontal bar and label.
- size_verticalfloat, default: 0
Vertical length of the size bar, given in coordinates of transform.
- colorstr, default: 'black'
Color for the size bar and label.
- label_topbool, default: False
If True, the label will be over the size bar.
- fontproperties
matplotlib.font_manager.FontProperties, optional Font properties for the label text.
- fill_barbool, optional
If True and if size_vertical is nonzero, the size bar will be filled in with the color specified by the size bar. Defaults to True if
size_verticalis greater than zero and False otherwise.- **kwargs
Keyworded arguments to pass to
matplotlib.offsetbox.AnchoredOffsetbox.
Notes
If prop is passed as a keyworded argument, but fontproperties is not, then prop is be assumed to be the intended fontproperties. Using both prop and fontproperties is not supported.
Examples
>>> import matplotlib.pyplot as plt
>>> import numpy as np
>>> from mpl_toolkits.axes_grid1.anchored_artists import (
...     AnchoredSizeBar)
>>> fig, ax = plt.subplots()
>>> ax.imshow(np.random.random((10, 10)))
>>> bar = AnchoredSizeBar(ax.transData, 3, '3 data units', 4)
>>> ax.add_artist(bar)
>>> fig.show()
Using all the optional parameters
>>> import matplotlib.font_manager as fm
>>> fontprops = fm.FontProperties(size=14, family='monospace')
>>> bar = AnchoredSizeBar(ax.transData, 3, '3 units', 4, pad=0.5,
...                       sep=5, borderpad=0.5, frameon=False,
...                       size_vertical=0.5, color='white',
...                       fontproperties=fontprops)
Attributes: - size_bar
matplotlib.offsetbox.AuxTransformBox Container for the size bar.
- txt_label
matplotlib.offsetbox.TextArea Container for the label of the size bar.
- transform
-
__module__= 'mpl_toolkits.axes_grid1.anchored_artists'
- transform