matplotlib.pyplot.stem
-
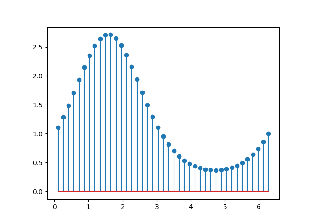
matplotlib.pyplot.stem(*args, linefmt=None, markerfmt=None, basefmt=None, bottom=0, label=None, use_line_collection=True, data=None)[source]¶ Create a stem plot.
A stem plot plots vertical lines at each x location from the baseline to y, and places a marker there.
Call signature:
stem([x,] y, linefmt=None, markerfmt=None, basefmt=None)
The x-positions are optional. The formats may be provided either as positional or as keyword-arguments.
Parameters: - xarray-like, optional
The x-positions of the stems. Default: (0, 1, ..., len(y) - 1).
- yarray-like
The y-values of the stem heads.
- linefmtstr, optional
A string defining the properties of the vertical lines. Usually, this will be a color or a color and a linestyle:
Character Line Style '-'solid line '--'dashed line '-.'dash-dot line ':'dotted line Default: 'C0-', i.e. solid line with the first color of the color cycle.
Note: While it is technically possible to specify valid formats other than color or color and linestyle (e.g. 'rx' or '-.'), this is beyond the intention of the method and will most likely not result in a reasonable plot.
- markerfmtstr, optional
A string defining the properties of the markers at the stem heads. Default: 'C0o', i.e. filled circles with the first color of the color cycle.
- basefmtstr, default: 'C3-' ('C2-' in classic mode)
A format string defining the properties of the baseline.
- bottomfloat, default: 0
The y-position of the baseline.
- labelstr, default: None
The label to use for the stems in legends.
- use_line_collectionbool, default: True
If
True, store and plot the stem lines as aLineCollectioninstead of individual lines, which significantly increases performance. IfFalse, defaults to the old behavior of using a list ofLine2Dobjects. This parameter may be deprecated in the future.
Returns: StemContainerThe container may be treated like a tuple (markerline, stemlines, baseline)
Notes
See also
The MATLAB function stem which inspired this method.
Note
In addition to the above described arguments, this function can take a data keyword argument. If such a data argument is given, every other argument can also be string
s, which is interpreted asdata[s](unless this raises an exception).Objects passed as data must support item access (
data[s]) and membership test (s in data).