matplotlib.pyplot.spy
-
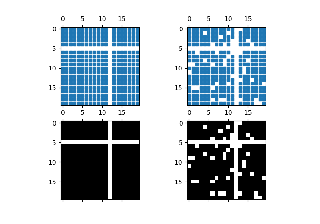
matplotlib.pyplot.spy(Z, precision=0, marker=None, markersize=None, aspect='equal', origin='upper', **kwargs)[source]¶ Plot the sparsity pattern of a 2D array.
This visualizes the non-zero values of the array.
Two plotting styles are available: image and marker. Both are available for full arrays, but only the marker style works for
scipy.sparse.spmatrixinstances.Image style
If marker and markersize are None,
imshowis used. Any extra remaining keyword arguments are passed to this method.Marker style
If Z is a
scipy.sparse.spmatrixor marker or markersize are None, aLine2Dobject will be returned with the value of marker determining the marker type, and any remaining keyword arguments passed toplot.Parameters: - Zarray-like (M, N)
The array to be plotted.
- precisionfloat or 'present', default: 0
If precision is 0, any non-zero value will be plotted. Otherwise, values of \(|Z| > precision\) will be plotted.
For
scipy.sparse.spmatrixinstances, you can also pass 'present'. In this case any value present in the array will be plotted, even if it is identically zero.- aspect{'equal', 'auto', None} or float, default: 'equal'
The aspect ratio of the axes. This parameter is particularly relevant for images since it determines whether data pixels are square.
This parameter is a shortcut for explicitly calling
Axes.set_aspect. See there for further details.- 'equal': Ensures an aspect ratio of 1. Pixels will be square.
- 'auto': The axes is kept fixed and the aspect is adjusted so that the data fit in the axes. In general, this will result in non-square pixels.
- None: Use
rcParams["image.aspect"](default:'equal').
- origin{'upper', 'lower'}, default:
rcParams["image.origin"](default:'upper') Place the [0, 0] index of the array in the upper left or lower left corner of the axes. The convention 'upper' is typically used for matrices and images.
Returns: Other Parameters: - **kwargs
The supported additional parameters depend on the plotting style.
For the image style, you can pass the following additional parameters of
imshow:For the marker style, you can pass any
Line2Dproperty except for linestyle:Property Description agg_filtera filter function, which takes a (m, n, 3) float array and a dpi value, and returns a (m, n, 3) array alphafloat or None animatedbool antialiasedor aabool clip_boxBboxclip_onbool clip_pathPatch or (Path, Transform) or None coloror ccolor containsunknown dash_capstyle{'butt', 'round', 'projecting'} dash_joinstyle{'miter', 'round', 'bevel'} dashessequence of floats (on/off ink in points) or (None, None) data(2, N) array or two 1D arrays drawstyleor ds{'default', 'steps', 'steps-pre', 'steps-mid', 'steps-post'}, default: 'default' figureFigurefillstyle{'full', 'left', 'right', 'bottom', 'top', 'none'} gidstr in_layoutbool labelobject linestyleor ls{'-', '--', '-.', ':', '', (offset, on-off-seq), ...} linewidthor lwfloat markermarker style string, PathorMarkerStylemarkeredgecoloror meccolor markeredgewidthor mewfloat markerfacecoloror mfccolor markerfacecoloraltor mfcaltcolor markersizeor msfloat markeveryNone or int or (int, int) or slice or List[int] or float or (float, float) or List[bool] path_effectsAbstractPathEffectpickerunknown pickradiusfloat rasterizedbool or None sketch_params(scale: float, length: float, randomness: float) snapbool or None solid_capstyle{'butt', 'round', 'projecting'} solid_joinstyle{'miter', 'round', 'bevel'} transformmatplotlib.transforms.Transformurlstr visiblebool xdata1D array ydata1D array zorderfloat