matplotlib.axes.Axes.axline
-
Axes.axline(self, xy1, xy2=None, *, slope=None, **kwargs)[source]¶ Add an infinitely long straight line.
The line can be defined either by two points xy1 and xy2, or by one point xy1 and a slope.
This draws a straight line "on the screen", regardless of the x and y scales, and is thus also suitable for drawing exponential decays in semilog plots, power laws in loglog plots, etc. However, slope should only be used with linear scales; It has no clear meaning for all other scales, and thus the behavior is undefined. Please specify the line using the points xy1, xy2 for non-linear scales.
Parameters: - xy1, xy2(float, float)
Points for the line to pass through. Either xy2 or slope has to be given.
- slopefloat, optional
The slope of the line. Either xy2 or slope has to be given.
Returns: Other Parameters: - **kwargs
Valid kwargs are
Line2Dproperties, with the exception of 'transform':Property Description agg_filtera filter function, which takes a (m, n, 3) float array and a dpi value, and returns a (m, n, 3) array alphafloat or None animatedbool antialiasedor aabool clip_boxBboxclip_onbool clip_pathPatch or (Path, Transform) or None coloror ccolor containsunknown dash_capstyle{'butt', 'round', 'projecting'} dash_joinstyle{'miter', 'round', 'bevel'} dashessequence of floats (on/off ink in points) or (None, None) data(2, N) array or two 1D arrays drawstyleor ds{'default', 'steps', 'steps-pre', 'steps-mid', 'steps-post'}, default: 'default' figureFigurefillstyle{'full', 'left', 'right', 'bottom', 'top', 'none'} gidstr in_layoutbool labelobject linestyleor ls{'-', '--', '-.', ':', '', (offset, on-off-seq), ...} linewidthor lwfloat markermarker style string, PathorMarkerStylemarkeredgecoloror meccolor markeredgewidthor mewfloat markerfacecoloror mfccolor markerfacecoloraltor mfcaltcolor markersizeor msfloat markeveryNone or int or (int, int) or slice or List[int] or float or (float, float) or List[bool] path_effectsAbstractPathEffectpickerunknown pickradiusfloat rasterizedbool or None sketch_params(scale: float, length: float, randomness: float) snapbool or None solid_capstyle{'butt', 'round', 'projecting'} solid_joinstyle{'miter', 'round', 'bevel'} transformmatplotlib.transforms.Transformurlstr visiblebool xdata1D array ydata1D array zorderfloat
Examples
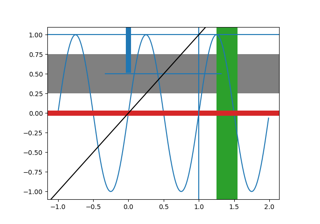
Draw a thick red line passing through (0, 0) and (1, 1):
>>> axline((0, 0), (1, 1), linewidth=4, color='r')