Note
Click here to download the full example code
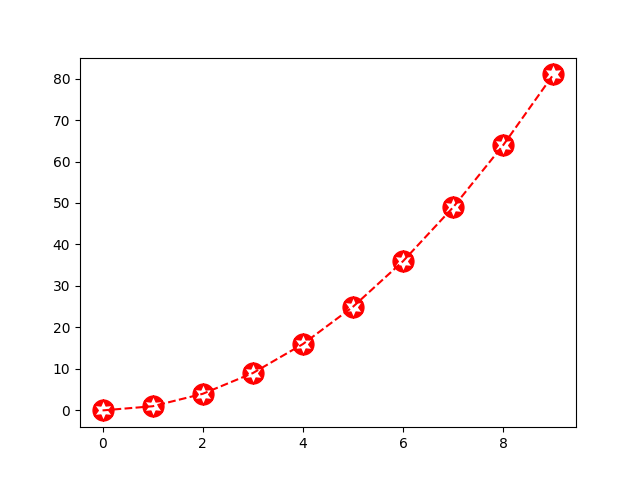
Marker Path
Using a Path as marker for a plot.
import matplotlib.pyplot as plt
import matplotlib.path as mpath
import numpy as np


star = mpath.Path.unit_regular_star(6)
circle = mpath.Path.unit_circle()
# concatenate the circle with an internal cutout of the star
verts = np.concatenate([circle.vertices, star.vertices[::-1, ...]])
codes = np.concatenate([circle.codes, star.codes])
cut_star = mpath.Path(verts, codes)


plt.plot(np.arange(10)**2, '--r', marker=cut_star, markersize=15)

plt.show()
References
The use of the following functions, methods, classes and modules is shown in this example:
Out:
<function plot at 0x7f280fdd9b80>
Keywords: matplotlib code example, codex, python plot, pyplot Gallery generated by Sphinx-Gallery