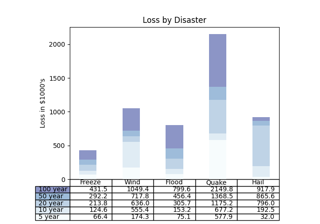
matplotlib.pyplot.table
-
matplotlib.pyplot.table(cellText=None, cellColours=None, cellLoc='right', colWidths=None, rowLabels=None, rowColours=None, rowLoc='left', colLabels=None, colColours=None, colLoc='center', loc='bottom', bbox=None, edges='closed', **kwargs)[source]¶ Add a table to an
Axes.At least one of cellText or cellColours must be specified. These parameters must be 2D lists, in which the outer lists define the rows and the inner list define the column values per row. Each row must have the same number of elements.
The table can optionally have row and column headers, which are configured using rowLabels, rowColours, rowLoc and colLabels, colColours, colLoc respectively.
For finer grained control over tables, use the
Tableclass and add it to the axes withAxes.add_table.Parameters: - cellText2D list of str, optional
The texts to place into the table cells.
Note: Line breaks in the strings are currently not accounted for and will result in the text exceeding the cell boundaries.
- cellColours2D list of colors, optional
The background colors of the cells.
- cellLoc{'left', 'center', 'right'}, default: 'right'
The alignment of the text within the cells.
- colWidthslist of float, optional
The column widths in units of the axes. If not given, all columns will have a width of 1 / ncols.
- rowLabelslist of str, optional
The text of the row header cells.
- rowColourslist of colors, optional
The colors of the row header cells.
- rowLoc{'left', 'center', 'right'}, default: 'left'
The text alignment of the row header cells.
- colLabelslist of str, optional
The text of the column header cells.
- colColourslist of colors, optional
The colors of the column header cells.
- colLoc{'left', 'center', 'right'}, default: 'left'
The text alignment of the column header cells.
- locstr, optional
The position of the cell with respect to ax. This must be one of the
codes.- bbox
Bbox, optional A bounding box to draw the table into. If this is not None, this overrides loc.
- edgessubstring of 'BRTL' or {'open', 'closed', 'horizontal', 'vertical'}
The cell edges to be drawn with a line. See also
visible_edges.
Returns: TableThe created table.
Other Parameters: - **kwargs
Tableproperties.Property Description agg_filtera filter function, which takes a (m, n, 3) float array and a dpi value, and returns a (m, n, 3) array alphafloat or None animatedbool clip_boxBboxclip_onbool clip_pathPatch or (Path, Transform) or None containsunknown figureFigurefontsizefloat gidstr in_layoutbool labelobject path_effectsAbstractPathEffectpickerNone or bool or callable rasterizedbool or None sketch_params(scale: float, length: float, randomness: float) snapbool or None transformTransformurlstr visiblebool zorderfloat