Note
Click here to download the full example code
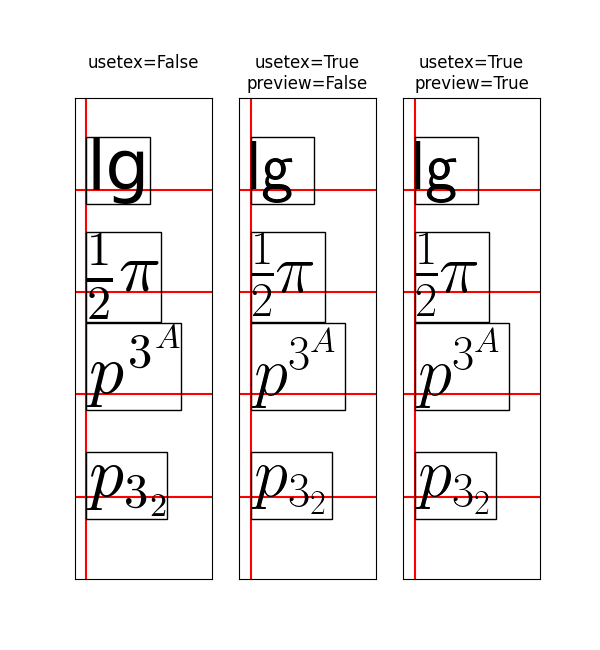
Usetex Baseline Test
A test for rcParams["text.latex.preview"] (default: False), a deprecated feature which relied
on the preview.sty LaTeX package to properly align TeX baselines. This
feature has been deprecated as Matplotlib's dvi parser now computes baselines
just as well as preview.sty; this example will be removed together with
rcParams["text.latex.preview"] (default: False) after the deprecation elapses.
import matplotlib.pyplot as plt
import matplotlib.axes as maxes


plt.rcParams.update({"mathtext.fontset": "cm", "mathtext.rm": "serif"})


@maxes.subplot_class_factory
class LatexPreviewSubplot(maxes.Axes):
    """
    A hackish way to simultaneously draw texts with text.latex.preview=True and
    text.latex.preview=False in the same figure.  It does not work with the ps
    backend.
    """

    def __init__(self, *args, preview=False, **kwargs):
        self.preview = preview
        super().__init__(*args, **kwargs)

    def draw(self, renderer):
        with plt.rc_context({"text.latex.preview": self.preview}):
            super().draw(renderer)


def test_window_extent(ax, usetex, preview):

    ax.xaxis.set_visible(False)
    ax.yaxis.set_visible(False)

    test_strings = ["lg", r"$\frac{1}{2}\pi$",
                    r"$p^{3^A}$", r"$p_{3_2}$"]

    ax.axvline(0, color="r")

    for i, s in enumerate(test_strings):
        ax.axhline(i, color="r")
        ax.text(0., 3 - i, s,
                usetex=usetex,
                verticalalignment="baseline",
                size=50,
                bbox=dict(pad=0, ec="k", fc="none"))

    ax.set_xlim(-0.1, 1.1)
    ax.set_ylim(-.8, 3.9)

    title = f"usetex={usetex}\n"
    if usetex:
        title += f"preview={preview}"
    ax.set_title(title)


fig = plt.figure(figsize=(2 * 3, 6.5))

for i, usetex, preview in [[0, False, False],
                           [1, True, False],
                           [2, True, True]]:
    ax = LatexPreviewSubplot(fig, 1, 3, i + 1, preview=preview)
    fig.add_subplot(ax)
    fig.subplots_adjust(top=0.85)

    test_window_extent(ax, usetex=usetex, preview=preview)


plt.show()
Keywords: matplotlib code example, codex, python plot, pyplot Gallery generated by Sphinx-Gallery