Note
Click here to download the full example code
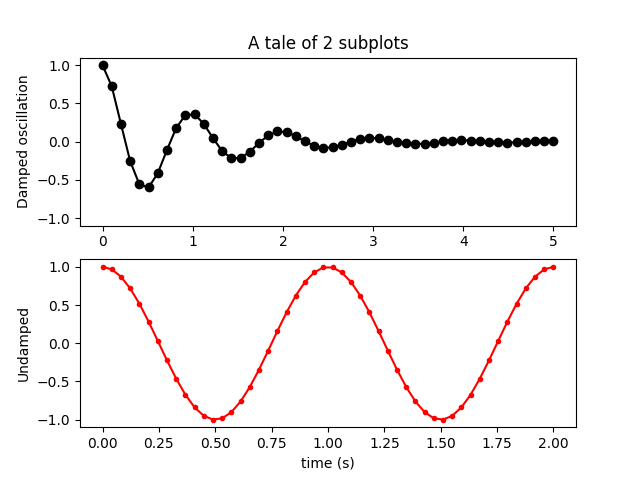
Basic Subplot Demo
Demo with two subplots. For more options, see Creating multiple subplots using plt.subplots
import numpy as np
import matplotlib.pyplot as plt

# Data for plotting
x1 = np.linspace(0.0, 5.0)
x2 = np.linspace(0.0, 2.0)
y1 = np.cos(2 * np.pi * x1) * np.exp(-x1)
y2 = np.cos(2 * np.pi * x2)

# Create two subplots sharing y axis
fig, (ax1, ax2) = plt.subplots(2, sharey=True)

ax1.plot(x1, y1, 'ko-')
ax1.set(title='A tale of 2 subplots', ylabel='Damped oscillation')

ax2.plot(x2, y2, 'r.-')
ax2.set(xlabel='time (s)', ylabel='Undamped')

plt.show()
Keywords: matplotlib code example, codex, python plot, pyplot Gallery generated by Sphinx-Gallery