Note
Click here to download the full example code
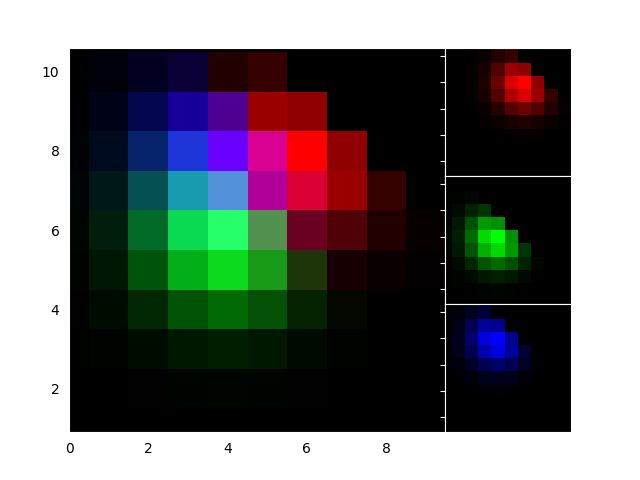
What's New 0.99 Axes Grid
Create RGB composite images.
import numpy as np
import matplotlib.pyplot as plt
from mpl_toolkits.axes_grid1.axes_rgb import RGBAxes


def get_demo_image():
    # prepare image
    delta = 0.5

    extent = (-3, 4, -4, 3)
    x = np.arange(-3.0, 4.001, delta)
    y = np.arange(-4.0, 3.001, delta)
    X, Y = np.meshgrid(x, y)
    Z1 = np.exp(-X**2 - Y**2)
    Z2 = np.exp(-(X - 1)**2 - (Y - 1)**2)
    Z = (Z1 - Z2) * 2

    return Z, extent


def get_rgb():
    Z, extent = get_demo_image()

    Z[Z < 0] = 0.
    Z = Z / Z.max()

    R = Z[:13, :13]
    G = Z[2:, 2:]
    B = Z[:13, 2:]

    return R, G, B


fig = plt.figure()
ax = RGBAxes(fig, [0.1, 0.1, 0.8, 0.8])

r, g, b = get_rgb()
ax.imshow_rgb(r, g, b, origin="lower")

ax.RGB.set_xlim(0., 9.5)
ax.RGB.set_ylim(0.9, 10.6)

plt.show()
References
The use of the following functions, methods, classes and modules is shown in this example:
import mpl_toolkits
mpl_toolkits.axes_grid1.axes_rgb.RGBAxes
mpl_toolkits.axes_grid1.axes_rgb.RGBAxes.imshow_rgb
Out:
<function RGBAxes.imshow_rgb at 0x7fedfba54550>
Keywords: matplotlib code example, codex, python plot, pyplot Gallery generated by Sphinx-Gallery