Note
Click here to download the full example code
Curve with error band
This example illustrates how to draw an error band around a parametrized curve.
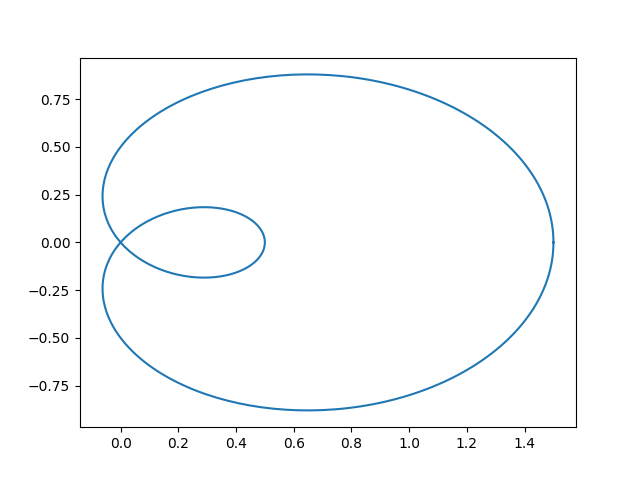
A parametrized curve x(t), y(t) can directly be drawn using plot.
import numpy as np
from scipy.interpolate import splprep, splev

import matplotlib.pyplot as plt
from matplotlib.path import Path
from matplotlib.patches import PathPatch

N = 400
t = np.linspace(0, 2 * np.pi, N)
r = 0.5 + np.cos(t)
x, y = r * np.cos(t), r * np.sin(t)

fig, ax = plt.subplots()
ax.plot(x, y)
plt.show()
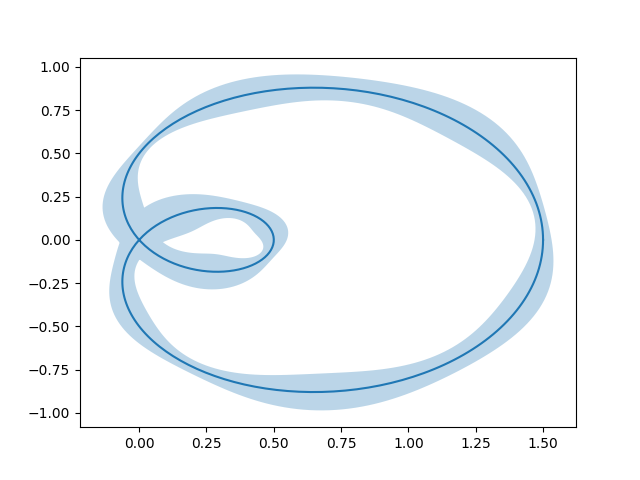
An error band can be used to indicate the uncertainty of the curve. In this example we assume that the error can be given as a scalar err that describes the uncertainty perpendicular to the curve in every point.
We visualize this error as a colored band around the path using a
PathPatch. The patch is created from two path segments (xp, yp), and
(xn, yn) that are shifted by +/- err perpendicular to the curve (x, y).
Note: This method of using a PathPatch is suited to arbitrary curves in
2D. If you just have a standard y-vs.-x plot, you can use the simpler
fill_between method (see also
Filling the area between lines).
# Error amplitudes depending on the curve parameter *t*
# (actual values are arbitrary and only for illustrative purposes):
err = 0.05 * np.sin(2 * t) ** 2 + 0.04 + 0.02 * np.cos(9 * t + 2)

# calculate normals via derivatives of splines
tck, u = splprep([x, y], s=0)
dx, dy = splev(u, tck, der=1)
l = np.hypot(dx, dy)
nx = dy / l
ny = -dx / l

# end points of errors
xp = x + nx * err
yp = y + ny * err
xn = x - nx * err
yn = y - ny * err

vertices = np.block([[xp, xn[::-1]],
                     [yp, yn[::-1]]]).T
codes = Path.LINETO * np.ones(len(vertices), dtype=Path.code_type)
codes[0] = codes[len(xp)] = Path.MOVETO
path = Path(vertices, codes)

patch = PathPatch(path, facecolor='C0', edgecolor='none', alpha=0.3)

fig, ax = plt.subplots()
ax.plot(x, y)
ax.add_patch(patch)
plt.show()
References
The use of the following functions, methods and classes is shown in this example:
import matplotlib
matplotlib.patches.PathPatch
matplotlib.path.Path
Keywords: matplotlib code example, codex, python plot, pyplot Gallery generated by Sphinx-Gallery