Note
Click here to download the full example code
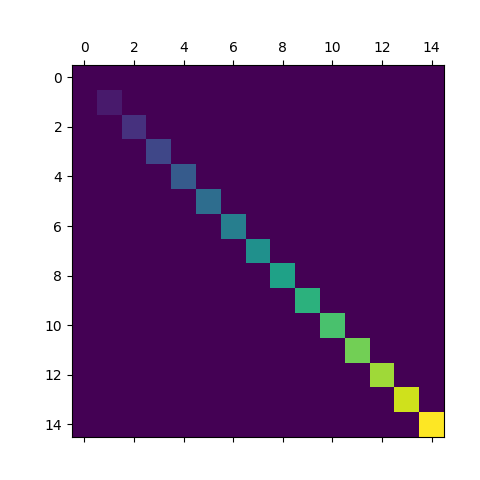
Matshow
matshow visualizes a 2D matrix or array as color-coded image.
import matplotlib.pyplot as plt
import numpy as np

# a 2D array with linearly increasing values on the diagonal
a = np.diag(range(15))

plt.matshow(a)

plt.show()
References
The use of the following functions and methods is shown in this example:
import matplotlib
matplotlib.axes.Axes.matshow
matplotlib.pyplot.matshow
Out:
<function matshow at 0x7fedfeb4cdc0>
Keywords: matplotlib code example, codex, python plot, pyplot Gallery generated by Sphinx-Gallery