Writing documentation
Contents
Getting started
General file structure
All documentation is built from the doc/, tutorials/, and
examples/ directories. The doc/ directory contains
configuration files for Sphinx and reStructuredText (ReST; .rst) files
that are rendered to documentation pages.
The main entry point is doc/index.rst, which pulls in the
index.rst file for the users guide (doc/users), developers
guide (doc/devel), api reference (doc/api), and FAQs
(doc/faq). The documentation suite is built as a single document in
order to make the most effective use of cross referencing.
Sphinx also creates .rst files that are staged in doc/api from
the docstrings of the classes in the Matplotlib library. Except for
doc/api/api_changes/, these .rst files are created when the
documentation is built.
Similarly, the contents of doc/gallery and doc/tutorials are
generated by the Sphinx Gallery from the sources in examples/ and
tutorials/. These sources consist of python scripts that have ReST
documentation built into their comments.
Note
Don't directly edit the .rst files in doc/gallery,
doc/tutorials, and doc/api (excepting
doc/api/api_changes/). Sphinx regenerates files in these
directories when building documentation.
Installing dependencies
The documentation for Matplotlib is generated from reStructuredText (ReST) using the Sphinx documentation generation tool. To build the documentation you will need to (1) set up an appropriate Python environment and (2) separately install LaTeX and Graphviz.
To (1) set up an appropriate Python environment for building the documentation, you should:
- create a clean virtual environment with no existing Matplotlib installation
- install the Python packages required for Matplotlib
- install the additional Python packages required to build the documentation
There are several extra python packages that are needed to build the
documentation. They are listed in doc-requirements.txt, which is
shown below:
# Requirements for building docs
#
# You will first need a matching Matplotlib installation
# e.g (from the Matplotlib root directory)
#     pip install -e .
#
# Install the documentation requirements with:
#     pip install -r requirements/doc/doc-requirements.txt
#
sphinx>=1.8.1,!=2.0.0
colorspacious
ipython
ipywidgets
numpydoc>=0.8
sphinxcontrib-svg2pdfconverter>=1.1.0
sphinx-gallery>=0.7
sphinx-copybutton
scipy
To (2) set up LaTeX and Graphviz dependencies you should:
- install a minimal working LaTeX distribution
- install the LaTeX packages cm-super and dvipng
- install Graphviz
Note
The documentation will not build without LaTeX and Graphviz. These are not Python packages and must be installed separately.
Building the docs
The documentation sources are found in the doc/ directory in the trunk.
The configuration file for Sphinx is doc/conf.py. It controls which
directories Sphinx parses, how the docs are built, and how the extensions are
used. To build the documentation in html format, cd into doc/ and run:
make html
Other useful invocations include
# Delete built files.  May help if you get errors about missing paths or
# broken links.
make clean

# Build pdf docs.
make latexpdf
The SPHINXOPTS variable is set to -W --keep-going by default to build
the complete docs but exit with exit status 1 if there are warnings. To unset
it, use
make SPHINXOPTS= html
On Windows the arguments must be at the end of the statement:
make html SPHINXOPTS=
You can use the O variable to set additional options:
make O=-j4 htmlruns a parallel build with 4 processes.make O=-Dplot_formats=png:100 htmlsaves figures in low resolution.make O=-Dplot_gallery=0 htmlskips the gallery build.
Multiple options can be combined using e.g. make O='-j4 -Dplot_gallery=0'
html.
On Windows, either use the format shown above or set options as environment variables, e.g.:
set O=-W --keep-going -j4
make html
Writing ReST pages
Most documentation is either in the docstring of individual
classes and methods, in explicit .rst files, or in examples and tutorials.
All of these use the ReST syntax. Users should look at the ReST documentation
for a full description. But some specific hints and conventions Matplotlib
uses are useful for creating documentation.
Formatting and style conventions
It is useful to strive for consistency in the Matplotlib documentation. Here are some formatting and style conventions that are used.
Section name formatting
For everything but top-level chapters, use Upper lower for
section titles, e.g., Possible hangups rather than Possible
Hangups
Function arguments
Function arguments and keywords within docstrings should be referred to using
the *emphasis* role. This will keep Matplotlib's documentation consistent
with Python's documentation:
Here is a description of *argument*
Do not use the `default role`:
Do not describe `argument` like this.  As per the next section,
this syntax will (unsuccessfully) attempt to resolve the argument as a
link to a class or method in the library.
nor the ``literal`` role:
Do not describe ``argument`` like this.
Referring to other documents and sections
Sphinx allows internal references between documents.
Documents can be linked with the :doc: directive:
See the :doc:`/faq/installing_faq`

See the tutorial :doc:`/tutorials/introductory/sample_plots`

See the example :doc:`/gallery/lines_bars_and_markers/simple_plot`
will render as:
Sections can also be given reference names. For instance from the Installation link:
.. _clean-install:

How to completely remove Matplotlib
===================================

Occasionally, problems with Matplotlib can be solved with a clean...
and refer to it using the standard reference syntax:
See :ref:`clean-install`
will give the following link: How to completely remove Matplotlib
To maximize internal consistency in section labeling and references,
use hyphen separated, descriptive labels for section references.
Keep in mind that contents may be reorganized later, so
avoid top level names in references like user or devel
or faq unless necessary, because for example the FAQ "what is a
backend?" could later become part of the users guide, so the label:
.. _what-is-a-backend:
is better than:
.. _faq-backend:
In addition, since underscores are widely used by Sphinx itself, use hyphens to separate words.
Referring to other code
To link to other methods, classes, or modules in Matplotlib you can use back ticks, for example:
`matplotlib.collections.LineCollection`
generates a link like this: matplotlib.collections.LineCollection.
Note: We use the sphinx setting default_role = 'obj' so that you don't
have to use qualifiers like :class:, :func:, :meth: and the likes.
Often, you don't want to show the full package and module name. As long as the target is unanbigous you can simply leave them out:
`.LineCollection`
and the link still works: LineCollection.
If there are multiple code elements with the same name (e.g. plot() is a
method in multiple classes), you'll have to extend the definition:
`.pyplot.plot` or `.Axes.plot`
These will show up as pyplot.plot or Axes.plot. To still show only the
last segment you can add a tilde as prefix:
`~.pyplot.plot` or `~.Axes.plot`
Other packages can also be linked via intersphinx:
`numpy.mean`
will return this link: numpy.mean. This works for Python, Numpy, Scipy,
and Pandas (full list is in doc/conf.py). If external linking fails,
you can check the full list of referenceable objects with the following
commands:
python -m sphinx.ext.intersphinx 'https://docs.python.org/3/objects.inv'
python -m sphinx.ext.intersphinx 'https://docs.scipy.org/doc/numpy/objects.inv'
python -m sphinx.ext.intersphinx 'https://docs.scipy.org/doc/scipy/reference/objects.inv'
python -m sphinx.ext.intersphinx 'https://pandas.pydata.org/pandas-docs/stable/objects.inv'
Including figures and files
Image files can directly included in pages with the image:: directive.
e.g., thirdpartypackages/index.rst displays the images for the third-party
packages as static images:
.. image:: /_static/toolbar.png
as rendered on the page: Third party packages.
Files can be included verbatim. For instance the matplotlibrc file
is important for customizing Matplotlib, and is included verbatim in the
tutorial in Customizing Matplotlib with style sheets and rcParams:
.. literalinclude:: ../../_static/matplotlibrc
This is rendered at the bottom of Customizing Matplotlib with style sheets and rcParams. Note that this is in a tutorial; see Writing examples and tutorials below.
The examples directory is also copied to doc/gallery by sphinx-gallery,
so plots from the examples directory can be included using
.. plot:: gallery/lines_bars_and_markers/simple_plot.py
Note that the python script that generates the plot is referred to, rather than any plot that is created. Sphinx-gallery will provide the correct reference when the documentation is built.
Writing docstrings
Most of the API documentation is written in docstrings. These are comment blocks in source code that explain how the code works.
Note
Some parts of the documentation do not yet conform to the current documentation style. If in doubt, follow the rules given here and not what you may see in the source code. Pull requests updating docstrings to the current style are very welcome.
All new or edited docstrings should conform to the numpydoc docstring guide.
Much of the ReST syntax discussed above (Writing ReST pages) can be
used for links and references. These docstrings eventually populate the
doc/api directory and form the reference documentation for the
library.
Example docstring
An example docstring looks like:
def hlines(self, y, xmin, xmax, colors='k', linestyles='solid',
           label='', **kwargs):
    """
    Plot horizontal lines at each *y* from *xmin* to *xmax*.

    Parameters
    ----------
    y : float or array-like
        y-indexes where to plot the lines.

    xmin, xmax : float or array-like
        Respective beginning and end of each line. If scalars are
        provided, all lines will have the same length.

    colors : array-like of colors, default: 'k'

    linestyles : {'solid', 'dashed', 'dashdot', 'dotted'}, default: 'solid'

    label : str, default: ''

    Returns
    -------
    lines : `~matplotlib.collections.LineCollection`

    Other Parameters
    ----------------
    **kwargs : `~matplotlib.collections.LineCollection` properties

    See also
    --------
    vlines : vertical lines
    axhline: horizontal line across the axes
    """
See the hlines documentation for how this renders.
The Sphinx website also contains plenty of documentation concerning ReST markup and working with Sphinx in general.
Formatting conventions
The basic docstring conventions are covered in the numpydoc docstring guide and the Sphinx documentation. Some Matplotlib-specific formatting conventions to keep in mind:
Quote positions
The quotes for single line docstrings are on the same line (pydocstyle D200):
def get_linewidth(self):
    """Return the line width in points."""
The quotes for multi-line docstrings are on separate lines (pydocstyle D213):
def set_linestyle(self, ls):
"""
Set the linestyle of the line.

[...]
"""
Function arguments
Function arguments and keywords within docstrings should be referred to
using the *emphasis* role. This will keep Matplotlib's documentation
consistent with Python's documentation:
If *linestyles* is *None*, the default is 'solid'.
Do not use the `default role` or the ``literal`` role:
Neither `argument` nor ``argument`` should be used.
Quotes for strings
Matplotlib does not have a convention whether to use single-quotes or double-quotes. There is a mixture of both in the current code.
Use simple single or double quotes when giving string values, e.g.
If 'tight', try to figure out the tight bbox of the figure.

No ``'extra'`` literal quotes.
The use of extra literal quotes around the text is discouraged. While they slightly improve the rendered docs, they are cumbersome to type and difficult to read in plain-text docs.
Parameter type descriptions
The main goal for parameter type descriptions is to be readable and understandable by humans. If the possible types are too complex use a simplification for the type description and explain the type more precisely in the text.
Generally, the numpydoc docstring guide conventions apply. The following rules expand on them where the numpydoc conventions are not specific.
Use float for a type that can be any number.
Use (float, float) to describe a 2D position. The parentheses should be
included to make the tuple-ness more obvious.
Use array-like for homogeneous numeric sequences, which could
typically be a numpy.array. Dimensionality may be specified using 2D,
3D, n-dimensional. If you need to have variables denoting the
sizes of the dimensions, use capital letters in brackets
(array-like (M, N)). When referring to them in the text they are easier
read and no special formatting is needed.
float is the implicit default dtype for array-likes. For other dtypes
use array-like of int.
Some possible uses:
2D array-like
array-like (N)
array-like (M, N)
array-like (M, N, 3)
array-like of int
Non-numeric homogeneous sequences are described as lists, e.g.:
list of str
list of `.Artist`
Referencing types
Generally, the rules from referring-to-other-code apply. More specifically:
Use full references `~matplotlib.colors.Normalize` with an
abbreviation tilde in parameter types. While the full name helps the
reader of plain text docstrings, the HTML does not need to show the full
name as it links to it. Hence, the ~-shortening keeps it more readable.
Use abbreviated links `.Normalize` in the text.
norm : `~matplotlib.colors.Normalize`, optional
     A `.Normalize` instance is used to scale luminance data to 0, 1.
Default values
As opposed to the numpydoc guide, parameters need not be marked as optional if they have a simple default:
- use
{name} : {type}, default: {val}when possible. - use
{name} : {type}, optionaland describe the default in the text if it cannot be explained sufficiently in the recommended manner.
The default value should provide semantic information targeted at a human reader. In simple cases, it restates the value in the function signature. If applicable, units should be added.
Prefer:
    interval : int, default: 1000ms
over:
    interval : int, default: 1000
If None is only used as a sentinel value for "parameter not specified", do not document it as the default. Depending on the context, give the actual default, or mark the parameter as optional if not specifying has no particular effect.
Prefer:
    dpi : float, default: :rc:`figure.dpi`
over:
    dpi : float, default: None

Prefer:
    textprops : dict, optional
        Dictionary of keyword parameters to be passed to the
        `~matplotlib.text.Text` instance contained inside TextArea.
over:
    textprops : dict, default: None
        Dictionary of keyword parameters to be passed to the
        `~matplotlib.text.Text` instance contained inside TextArea.
See also sections
Sphinx automatically links code elements in the definition blocks of See
also sections. No need to use backticks there:
See also
--------
vlines : vertical lines
axhline: horizontal line across the axes
Wrapping parameter lists
Long parameter lists should be wrapped using a \ for continuation and
starting on the new line without any indent (no indent because pydoc will
parse the docstring and strip the line continuation so that indent would
result in a lot of whitespace within the line):
def add_axes(self, *args, **kwargs):
    """
    ...

    Parameters
    ----------
    projection : {'aitoff', 'hammer', 'lambert', 'mollweide', 'polar', \
'rectilinear'}, optional
        The projection type of the axes.

    ...
    """
Alternatively, you can describe the valid parameter values in a dedicated section of the docstring.
Setters and getters
Artist properties are implemented using setter and getter methods (because
Matplotlib predates the introductions of the property decorator in Python).
By convention, these setters and getters are named set_PROPERTYNAME and
get_PROPERTYNAME; the list of properties thusly defined on an artist and
their values can be listed by the setp and getp functions.
The Parameters block of property setter methods is parsed to document the
accepted values, e.g. the docstring of Line2D.set_linestyle starts with
def set_linestyle(self, ls):
    """
    Set the linestyle of the line.

    Parameters
    ----------
    ls : {'-', '--', '-.', ':', '', (offset, on-off-seq), ...}
        etc.
    """
which results in the following line in the output of plt.setp(line) or
plt.setp(line, "linestyle"):
linestyle or ls: {'-', '--', '-.', ':', '', (offset, on-off-seq), ...}
In some rare cases (mostly, setters which accept both a single tuple and an
unpacked tuple), the accepted values cannot be documented in such a fashion;
in that case, they can be documented as an .. ACCEPTS: block, e.g. for
axes.Axes.set_xlim:
def set_xlim(self, ...):
    """
    Set the x-axis view limits.

    Parameters
    ----------
    left : float, optional
        The left xlim in data coordinates. Passing *None* leaves the
        limit unchanged.

        The left and right xlims may also be passed as the tuple
        (*left*, *right*) as the first positional argument (or as
        the *left* keyword argument).

        .. ACCEPTS: (bottom: float, top: float)

    right : float, optional
        etc.
    """
Note that the leading .. makes the .. ACCEPTS: block a reST comment,
hiding it from the rendered docs.
Keyword arguments
Note
The information in this section is being actively discussed by the development team, so use the docstring interpolation only if necessary. This section has been left in place for now because this interpolation is part of the existing documentation.
Since Matplotlib uses a lot of pass-through kwargs, e.g., in every function
that creates a line (plot, semilogx, semilogy,
etc...), it can be difficult for the new user to know which kwargs are
supported. Matplotlib uses a docstring interpolation scheme to support
documentation of every function that takes a **kwargs. The requirements
are:
- single point of configuration so changes to the properties don't require multiple docstring edits.
- as automated as possible so that as properties change, the docs are updated automatically.
The function matplotlib.artist.kwdoc and the decorator
matplotlib.docstring.dedent_interpd facilitate this. They combine Python
string interpolation in the docstring with the Matplotlib artist introspection
facility that underlies setp and getp. The kwdoc function gives
the list of properties as a docstring. In order to use this in another
docstring, first update the matplotlib.docstring.interpd object, as seen in
this example from matplotlib.lines:
# in lines.py
docstring.interpd.update(Line2D=artist.kwdoc(Line2D))
Then in any function accepting Line2D pass-through kwargs, e.g.,
matplotlib.axes.Axes.plot:
# in axes.py
@docstring.dedent_interpd
def plot(self, *args, **kwargs):
    """
    Some stuff omitted

    The kwargs are Line2D properties:
    %(_Line2D_docstr)s

    kwargs scalex and scaley, if defined, are passed on
    to autoscale_view to determine whether the x and y axes are
    autoscaled; default True.  See Axes.autoscale_view for more
    information
    """
Note there is a problem for Artist __init__ methods,
e.g., matplotlib.patches.Patch.__init__, which supports Patch kwargs,
since the artist inspector cannot work until the class is fully defined and
we can't modify the Patch.__init__.__doc__ docstring outside the class
definition. There are some some manual hacks in this case, violating the
"single entry point" requirement above -- see the docstring.interpd.update
calls in matplotlib.patches.
Inheriting docstrings
If a subclass overrides a method but does not change the semantics, we can reuse the parent docstring for the method of the child class. Python does this automatically, if the subclass method does not have a docstring.
Use a plain comment # docstring inherited to denote the intention to reuse
the parent docstring. That way we do not accidentally create a docstring in
the future:
class A:
    def foo():
        """The parent docstring."""
        pass

class B(A):
    def foo():
        # docstring inherited
        pass
Adding figures
As above (see Including figures and files), figures in the examples gallery
can be referenced with a :plot: directive pointing to the python script
that created the figure. For instance the legend docstring references
the file examples/text_labels_and_annotations/legend.py:
"""
...

Examples
--------

.. plot:: gallery/text_labels_and_annotations/legend.py
"""
Note that examples/text_labels_and_annotations/legend.py has been mapped to
gallery/text_labels_and_annotations/legend.py, a redirection that may be
fixed in future re-organization of the docs.
Plots can also be directly placed inside docstrings. Details are in matplotlib.sphinxext.plot_directive. A short example is:
"""
...

Examples
--------

.. plot::
   import matplotlib.image as mpimg
   img = mpimg.imread('_static/stinkbug.png')
   imgplot = plt.imshow(img)
"""
An advantage of this style over referencing an example script is that the code will also appear in interactive docstrings.
Writing examples and tutorials
Examples and tutorials are python scripts that are run by Sphinx Gallery
to create a gallery of images in the /doc/gallery and
/doc/tutorials directories respectively. To exclude an example
from having an plot generated insert "sgskip" somewhere in the filename.
The format of these files is relatively straightforward. Properly formatted comment blocks are treated as ReST text, the code is displayed, and figures are put into the built page.
For instance the example Simple Plot
example is generated from
/examples/lines_bars_and_markers/simple_plot.py, which looks like:
"""
===========
Simple Plot
===========

Create a simple plot.
"""
import matplotlib.pyplot as plt
import numpy as np

# Data for plotting
t = np.arange(0.0, 2.0, 0.01)
s = 1 + np.sin(2 * np.pi * t)

# Note that using plt.subplots below is equivalent to using
# fig = plt.figure and then ax = fig.add_subplot(111)
fig, ax = plt.subplots()
ax.plot(t, s)

ax.set(xlabel='time (s)', ylabel='voltage (mV)',
       title='About as simple as it gets, folks')
ax.grid()
plt.show()
The first comment block is treated as ReST text. The other comment blocks render as comments in Simple Plot.
Tutorials are made with the exact same mechanism, except they are longer, and
typically have more than one comment block (i.e.
Usage Guide). The first comment block
can be the same as the example above. Subsequent blocks of ReST text
are delimited by a line of ### characters:
"""
===========
Simple Plot
===========

Create a simple plot.
"""
...
ax.grid()
plt.show()

##########################################################################
# Second plot
# ===========
#
# This is a second plot that is very nice

fig, ax = plt.subplots()
ax.plot(np.sin(range(50)))
In this way text, code, and figures are output in a "notebook" style.
Order of examples in the gallery
The order of the sections of the Tutorials and the Gallery, as
well as the order of the examples within each section are determined in a
two step process from within the /doc/sphinxext/gallery_order.py:
- Explicit order: This file contains a list of folders for the section order and a list of examples for the subsection order. The order of the items shown in the doc pages is the order those items appear in those lists.
- Implicit order: If a folder or example is not in those lists, it will be appended after the explicitly ordered items and all of those additional items will be ordered by pathname (for the sections) or by filename (for the subsections).
As a consequence, if you want to let your example appear in a certain
position in the gallery, extend those lists with your example.
In case no explicit order is desired or necessary, still make sure
to name your example consistently, i.e. use the main function or subject
of the example as first word in the filename; e.g. an image example
should ideally be named similar to imshow_mynewexample.py.
Miscellaneous
Adding animations
Animations are scraped automatically by Sphinx-gallery. If this is not
desired,
there is also a Matplotlib Google/Gmail account with username mplgithub
which was used to setup the github account but can be used for other
purposes, like hosting Google docs or Youtube videos. You can embed a
Matplotlib animation in the docs by first saving the animation as a
movie using matplotlib.animation.Animation.save(), and then
uploading to Matplotlib's Youtube
channel and inserting the
embedding string youtube provides like:
.. raw:: html

   <iframe width="420" height="315"
     src="http://www.youtube.com/embed/32cjc6V0OZY"
     frameborder="0" allowfullscreen>
   </iframe>
An example save command to generate a movie looks like this
ani = animation.FuncAnimation(fig, animate, np.arange(1, len(y)),
    interval=25, blit=True, init_func=init)

ani.save('double_pendulum.mp4', fps=15)
Contact Michael Droettboom for the login password to upload youtube videos of google docs to the mplgithub account.
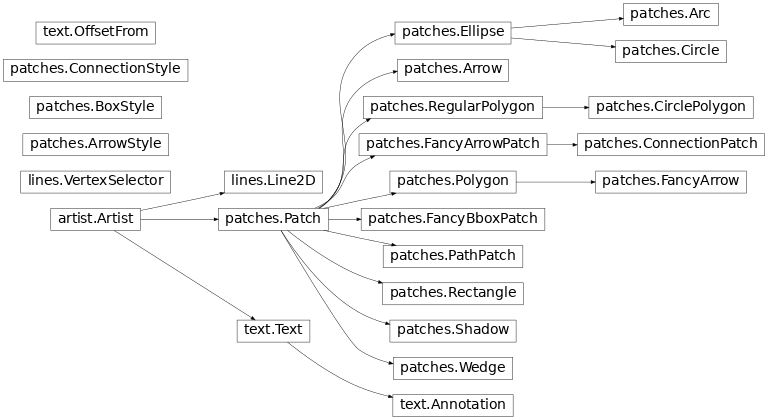
Generating inheritance diagrams
Class inheritance diagrams can be generated with the
inheritance-diagram directive. To use it, provide the
directive with a number of class or module names (separated by
whitespace). If a module name is provided, all classes in that module
will be used. All of the ancestors of these classes will be included
in the inheritance diagram.
A single option is available: parts controls how many of parts in
the path to the class are shown. For example, if parts == 1, the
class matplotlib.patches.Patch is shown as Patch. If parts
== 2, it is shown as patches.Patch. If parts == 0, the full
path is shown.
Example:
.. inheritance-diagram:: matplotlib.patches matplotlib.lines matplotlib.text
   :parts: 2
Emacs helpers
There is an emacs mode rst.el which
automates many important ReST tasks like building and updating
table-of-contents, and promoting or demoting section headings. Here
is the basic .emacs configuration:
(require 'rst)
(setq auto-mode-alist
      (append '(("\\.txt$" . rst-mode)
                ("\\.rst$" . rst-mode)
                ("\\.rest$" . rst-mode)) auto-mode-alist))
Some helpful functions:
C-c TAB - rst-toc-insert

  Insert table of contents at point

C-c C-u - rst-toc-update

    Update the table of contents at point

C-c C-l rst-shift-region-left

    Shift region to the left

C-c C-r rst-shift-region-right

    Shift region to the right