Interactive navigation
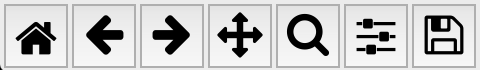
All figure windows come with a navigation toolbar, which can be used to navigate through the data set. Here is a description of each of the buttons at the bottom of the toolbar


- The
Home,ForwardandBackbuttons - These are akin to a web browser's home, forward and back controls.
ForwardandBackare used to navigate back and forth between previously defined views. They have no meaning unless you have already navigated somewhere else using the pan and zoom buttons. This is analogous to trying to clickBackon your web browser before visiting a new page orForwardbefore you have gone back to a page -- nothing happens.Homealways takes you to the first, default view of your data. Again, all of these buttons should feel very familiar to any user of a web browser.

- The
Pan/Zoombutton This button has two modes: pan and zoom. Click the toolbar button to activate panning and zooming, then put your mouse somewhere over an axes. Press the left mouse button and hold it to pan the figure, dragging it to a new position. When you release it, the data under the point where you pressed will be moved to the point where you released. If you press 'x' or 'y' while panning the motion will be constrained to the x or y axis, respectively. Press the right mouse button to zoom, dragging it to a new position. The x axis will be zoomed in proportionately to the rightward movement and zoomed out proportionately to the leftward movement. The same is true for the y axis and up/down motions. The point under your mouse when you begin the zoom remains stationary, allowing you to zoom in or out around that point as much as you wish. You can use the modifier keys 'x', 'y' or 'CONTROL' to constrain the zoom to the x axis, the y axis, or aspect ratio preserve, respectively.
With polar plots, the pan and zoom functionality behaves differently. The radius axis labels can be dragged using the left mouse button. The radius scale can be zoomed in and out using the right mouse button.

- The
Zoom-to-rectanglebutton - Click this toolbar button to activate this mode. Put your mouse somewhere over an axes and press a mouse button. Define a rectangular region by dragging the mouse while holding the button to a new location. When using the left mouse button, the axes view limits will be zoomed to the defined region. When using the right mouse button, the axes view limits will be zoomed out, placing the original axes in the defined region.

- The
Subplot-configurationbutton - Use this tool to configure the appearance of the subplot: you can stretch or compress the left, right, top, or bottom side of the subplot, or the space between the rows or space between the columns.

- The
Savebutton - Click this button to launch a file save dialog. You can save
files with the following extensions:
png,ps,eps,svgandpdf.