Note
Click here to download the full example code
Geographic Projections
This shows 4 possible projections using subplot. Matplotlib also supports Basemaps Toolkit and Cartopy for geographic projections.
import matplotlib.pyplot as plt
plt.figure()
plt.subplot(111, projection="aitoff")
plt.title("Aitoff")
plt.grid(True)

plt.figure()
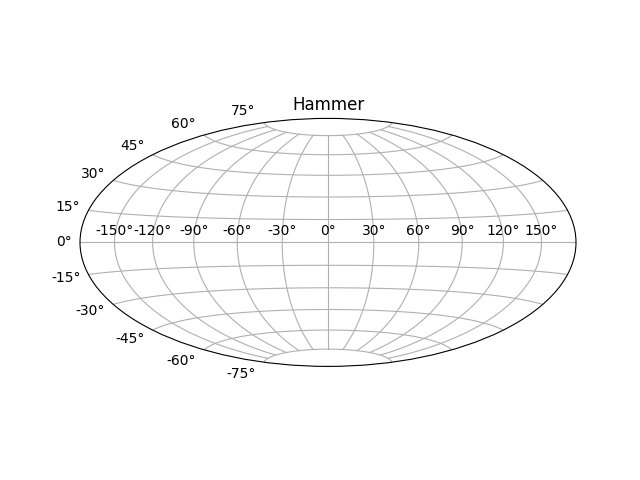
plt.subplot(111, projection="hammer")
plt.title("Hammer")
plt.grid(True)
plt.figure()
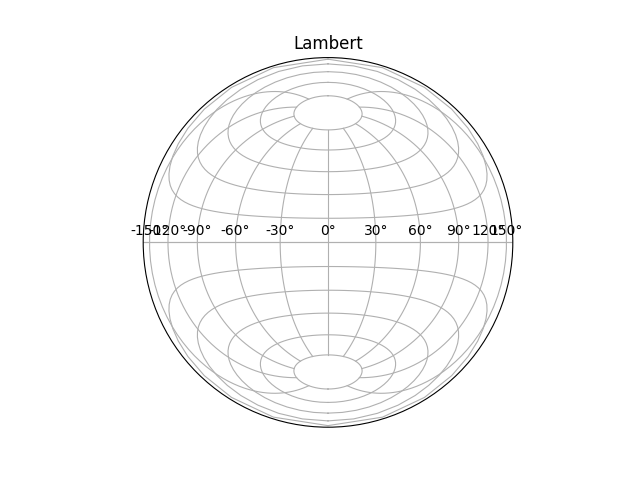
plt.subplot(111, projection="lambert")
plt.title("Lambert")
plt.grid(True)
plt.figure()
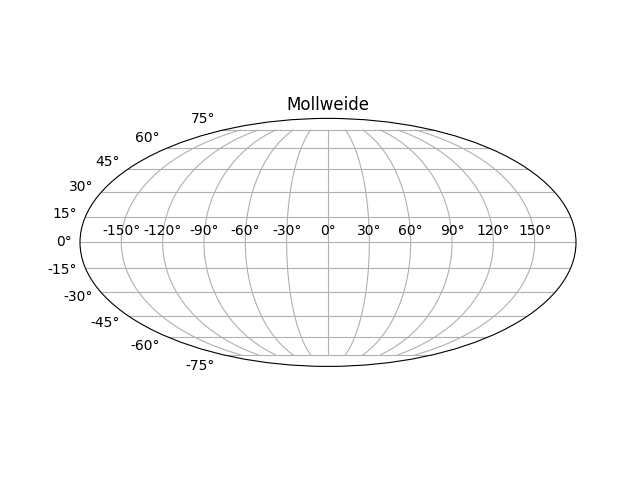
plt.subplot(111, projection="mollweide")
plt.title("Mollweide")
plt.grid(True)
plt.show()
Keywords: matplotlib code example, codex, python plot, pyplot Gallery generated by Sphinx-Gallery