Note
Click here to download the full example code
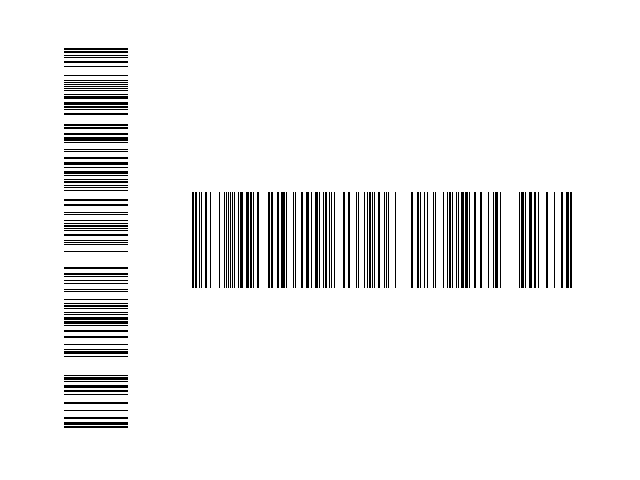
Barcode Demo
This demo shows how to produce a one-dimensional image, or "bar code".
import matplotlib.pyplot as plt
import numpy as np

# Fixing random state for reproducibility
np.random.seed(19680801)

# the bar
x = np.random.rand(500) > 0.7

barprops = dict(aspect='auto', cmap='binary', interpolation='nearest')

fig = plt.figure()

# a vertical barcode
ax1 = fig.add_axes([0.1, 0.1, 0.1, 0.8])
ax1.set_axis_off()
ax1.imshow(x.reshape((-1, 1)), **barprops)

# a horizontal barcode
ax2 = fig.add_axes([0.3, 0.4, 0.6, 0.2])
ax2.set_axis_off()
ax2.imshow(x.reshape((1, -1)), **barprops)

plt.show()
References
The use of the following functions, methods and classes is shown in this example:
import matplotlib
matplotlib.axes.Axes.imshow
matplotlib.pyplot.imshow
Out:
<function imshow at 0x7f61601a3af0>
Keywords: matplotlib code example, codex, python plot, pyplot Gallery generated by Sphinx-Gallery