matplotlib.pyplot.axhspan
-
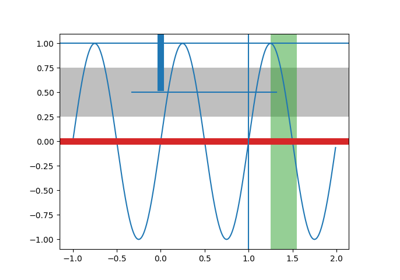
matplotlib.pyplot.axhspan(ymin, ymax, xmin=0, xmax=1, **kwargs)[source]¶ Add a horizontal span (rectangle) across the axis.
Draw a horizontal span (rectangle) from ymin to ymax. With the default values of xmin = 0 and xmax = 1, this always spans the xrange, regardless of the xlim settings, even if you change them, e.g., with the
set_xlim()command. That is, the horizontal extent is in axes coords: 0=left, 0.5=middle, 1.0=right but the y location is in data coordinates.Parameters: - yminfloat
Lower limit of the horizontal span in data units.
- ymaxfloat
Upper limit of the horizontal span in data units.
- xminfloat, optional, default: 0
Lower limit of the vertical span in axes (relative 0-1) units.
- xmaxfloat, optional, default: 1
Upper limit of the vertical span in axes (relative 0-1) units.
Returns: - Polygon
Polygon
Other Parameters: - **kwargs
Polygonproperties. Property Description agg_filtera filter function, which takes a (m, n, 3) float array and a dpi value, and returns a (m, n, 3) array alphafloat or None animatedbool antialiasedor aaunknown capstyle{'butt', 'round', 'projecting'} clip_boxBboxclip_onbool clip_pathPatch or (Path, Transform) or None colorcolor containscallable edgecoloror eccolor or None or 'auto' facecoloror fccolor or None figureFigurefillbool gidstr hatch{'/', '\', '|', '-', '+', 'x', 'o', 'O', '.', '*'} in_layoutbool joinstyle{'miter', 'round', 'bevel'} labelobject linestyleor ls{'-', '--', '-.', ':', '', (offset, on-off-seq), ...} linewidthor lwfloat or None path_effectsAbstractPathEffectpickerNone or bool or float or callable rasterizedbool or None sketch_params(scale: float, length: float, randomness: float) snapbool or None transformTransformurlstr visiblebool zorderfloat
See also
axvspan- Add a vertical span across the axes.