matplotlib.axes.Axes.semilogx
-
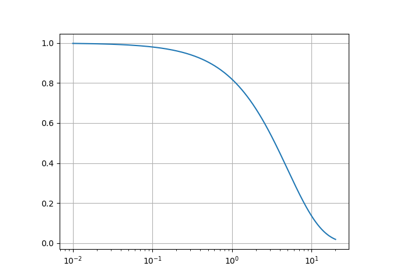
Axes.semilogx(self, *args, **kwargs)[source]¶ Make a plot with log scaling on the x axis.
Call signatures:
semilogx([x], y, [fmt], data=None, **kwargs)
semilogx([x], y, [fmt], [x2], y2, [fmt2], ..., **kwargs)
This is just a thin wrapper around
plotwhich additionally changes the x-axis to log scaling. All of the concepts and parameters of plot can be used here as well.The additional parameters basex, subsx and nonposx control the x-axis properties. They are just forwarded to
Axes.set_xscale.Parameters: - basexscalar, optional, default 10
Base of the x logarithm.
- subsxarray-like, optional
The location of the minor xticks. If None, reasonable locations are automatically chosen depending on the number of decades in the plot. See
Axes.set_xscalefor details.- nonposx{'mask', 'clip'}, optional, default 'mask'
Non-positive values in x can be masked as invalid, or clipped to a very small positive number.
Returns: - lines
A list of
Line2Dobjects representing the plotted data.
Other Parameters: - **kwargs
All parameters supported by
plot.