Note
Click here to download the full example code
Ellipse With Units
Compare the ellipse generated with arcs versus a polygonal approximation
This example requires basic_units.py
from basic_units import cm
import numpy as np
from matplotlib import patches
import matplotlib.pyplot as plt


xcenter, ycenter = 0.38*cm, 0.52*cm
width, height = 1e-1*cm, 3e-1*cm
angle = -30

theta = np.deg2rad(np.arange(0.0, 360.0, 1.0))
x = 0.5 * width * np.cos(theta)
y = 0.5 * height * np.sin(theta)

rtheta = np.radians(angle)
R = np.array([
    [np.cos(rtheta), -np.sin(rtheta)],
    [np.sin(rtheta),  np.cos(rtheta)],
    ])


x, y = np.dot(R, np.array([x, y]))
x += xcenter
y += ycenter
fig = plt.figure()
ax = fig.add_subplot(211, aspect='auto')
ax.fill(x, y, alpha=0.2, facecolor='yellow',
        edgecolor='yellow', linewidth=1, zorder=1)

e1 = patches.Ellipse((xcenter, ycenter), width, height,
                     angle=angle, linewidth=2, fill=False, zorder=2)

ax.add_patch(e1)

ax = fig.add_subplot(212, aspect='equal')
ax.fill(x, y, alpha=0.2, facecolor='green', edgecolor='green', zorder=1)
e2 = patches.Ellipse((xcenter, ycenter), width, height,
                     angle=angle, linewidth=2, fill=False, zorder=2)


ax.add_patch(e2)
fig.savefig('ellipse_compare')
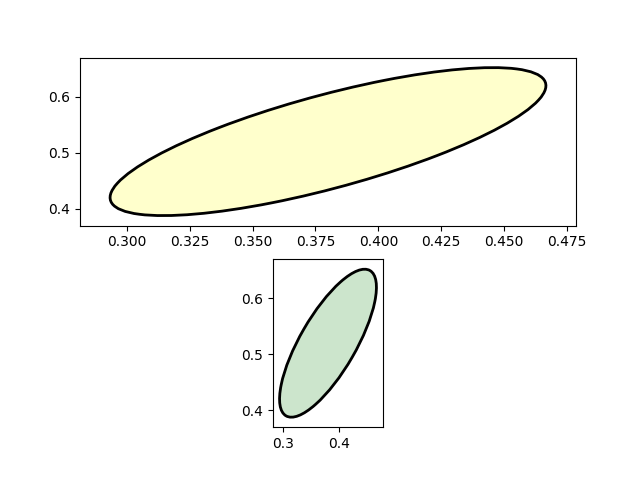
fig = plt.figure()
ax = fig.add_subplot(211, aspect='auto')
ax.fill(x, y, alpha=0.2, facecolor='yellow',
        edgecolor='yellow', linewidth=1, zorder=1)

e1 = patches.Arc((xcenter, ycenter), width, height,
                 angle=angle, linewidth=2, fill=False, zorder=2)

ax.add_patch(e1)

ax = fig.add_subplot(212, aspect='equal')
ax.fill(x, y, alpha=0.2, facecolor='green', edgecolor='green', zorder=1)
e2 = patches.Arc((xcenter, ycenter), width, height,
                 angle=angle, linewidth=2, fill=False, zorder=2)


ax.add_patch(e2)
fig.savefig('arc_compare')

plt.show()

Keywords: matplotlib code example, codex, python plot, pyplot Gallery generated by Sphinx-Gallery