Note
Click here to download the full example code
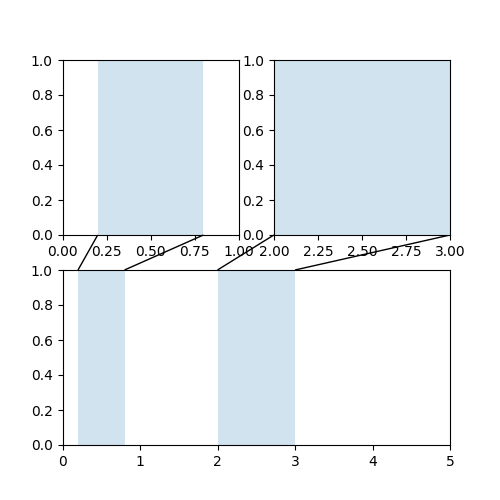
Axes Zoom Effect
from matplotlib.transforms import (
    Bbox, TransformedBbox, blended_transform_factory)
from mpl_toolkits.axes_grid1.inset_locator import (
    BboxPatch, BboxConnector, BboxConnectorPatch)


def connect_bbox(bbox1, bbox2,
                 loc1a, loc2a, loc1b, loc2b,
                 prop_lines, prop_patches=None):
    if prop_patches is None:
        prop_patches = {
            **prop_lines,
            "alpha": prop_lines.get("alpha", 1) * 0.2,
        }

    c1 = BboxConnector(bbox1, bbox2, loc1=loc1a, loc2=loc2a, **prop_lines)
    c1.set_clip_on(False)
    c2 = BboxConnector(bbox1, bbox2, loc1=loc1b, loc2=loc2b, **prop_lines)
    c2.set_clip_on(False)

    bbox_patch1 = BboxPatch(bbox1, **prop_patches)
    bbox_patch2 = BboxPatch(bbox2, **prop_patches)

    p = BboxConnectorPatch(bbox1, bbox2,
                           # loc1a=3, loc2a=2, loc1b=4, loc2b=1,
                           loc1a=loc1a, loc2a=loc2a, loc1b=loc1b, loc2b=loc2b,
                           **prop_patches)
    p.set_clip_on(False)

    return c1, c2, bbox_patch1, bbox_patch2, p


def zoom_effect01(ax1, ax2, xmin, xmax, **kwargs):
    """
    Connect *ax1* and *ax2*. The *xmin*-to-*xmax* range in both axes will
    be marked.

    Parameters
    ----------
    ax1
        The main axes.
    ax2
        The zoomed axes.
    xmin, xmax
        The limits of the colored area in both plot axes.
    **kwargs
        Arguments passed to the patch constructor.
    """

    trans1 = blended_transform_factory(ax1.transData, ax1.transAxes)
    trans2 = blended_transform_factory(ax2.transData, ax2.transAxes)

    bbox = Bbox.from_extents(xmin, 0, xmax, 1)

    mybbox1 = TransformedBbox(bbox, trans1)
    mybbox2 = TransformedBbox(bbox, trans2)

    prop_patches = {**kwargs, "ec": "none", "alpha": 0.2}

    c1, c2, bbox_patch1, bbox_patch2, p = connect_bbox(
        mybbox1, mybbox2,
        loc1a=3, loc2a=2, loc1b=4, loc2b=1,
        prop_lines=kwargs, prop_patches=prop_patches)

    ax1.add_patch(bbox_patch1)
    ax2.add_patch(bbox_patch2)
    ax2.add_patch(c1)
    ax2.add_patch(c2)
    ax2.add_patch(p)

    return c1, c2, bbox_patch1, bbox_patch2, p


def zoom_effect02(ax1, ax2, **kwargs):
    """
    ax1 : the main axes
    ax1 : the zoomed axes

    Similar to zoom_effect01.  The xmin & xmax will be taken from the
    ax1.viewLim.
    """

    tt = ax1.transScale + (ax1.transLimits + ax2.transAxes)
    trans = blended_transform_factory(ax2.transData, tt)

    mybbox1 = ax1.bbox
    mybbox2 = TransformedBbox(ax1.viewLim, trans)

    prop_patches = {**kwargs, "ec": "none", "alpha": 0.2}

    c1, c2, bbox_patch1, bbox_patch2, p = connect_bbox(
        mybbox1, mybbox2,
        loc1a=3, loc2a=2, loc1b=4, loc2b=1,
        prop_lines=kwargs, prop_patches=prop_patches)

    ax1.add_patch(bbox_patch1)
    ax2.add_patch(bbox_patch2)
    ax2.add_patch(c1)
    ax2.add_patch(c2)
    ax2.add_patch(p)

    return c1, c2, bbox_patch1, bbox_patch2, p


import matplotlib.pyplot as plt

plt.figure(figsize=(5, 5))
ax1 = plt.subplot(221)
ax2 = plt.subplot(212)
ax2.set_xlim(0, 1)
ax2.set_xlim(0, 5)
zoom_effect01(ax1, ax2, 0.2, 0.8)


ax1 = plt.subplot(222)
ax1.set_xlim(2, 3)
ax2.set_xlim(0, 5)
zoom_effect02(ax1, ax2)

plt.show()
Keywords: matplotlib code example, codex, python plot, pyplot Gallery generated by Sphinx-Gallery