Note
Click here to download the full example code
Controlling view limits using margins and sticky_edges
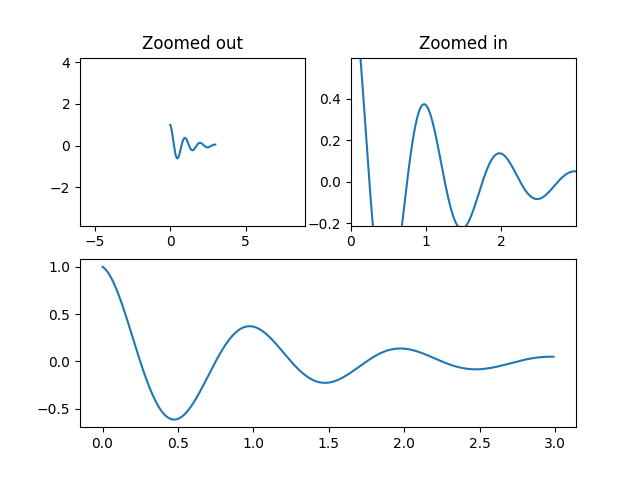
The first figure in this example shows how to zoom in and out of a
plot using margins instead of set_xlim and
set_ylim. The second figure demonstrates the concept of
edge "stickiness" introduced by certain methods and artists and how
to effectively work around that.
import numpy as np
import matplotlib.pyplot as plt


def f(t):
    return np.exp(-t) * np.cos(2*np.pi*t)


t1 = np.arange(0.0, 3.0, 0.01)

ax1 = plt.subplot(212)
ax1.margins(0.05)           # Default margin is 0.05, value 0 means fit
ax1.plot(t1, f(t1))

ax2 = plt.subplot(221)
ax2.margins(2, 2)           # Values >0.0 zoom out
ax2.plot(t1, f(t1))
ax2.set_title('Zoomed out')

ax3 = plt.subplot(222)
ax3.margins(x=0, y=-0.25)   # Values in (-0.5, 0.0) zooms in to center
ax3.plot(t1, f(t1))
ax3.set_title('Zoomed in')

plt.show()
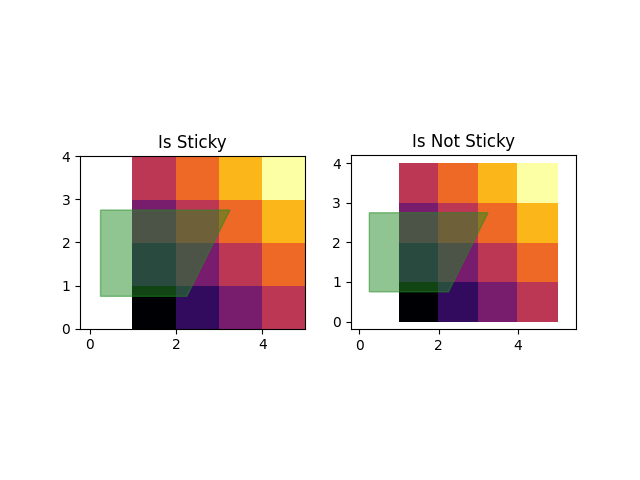
On the "stickiness" of certain plotting methods
Some plotting functions make the axis limits "sticky" or immune to the will
of the margins methods. For instance, imshow and
pcolor expect the user to want the limits to be tight around the
pixels shown in the plot. If this behavior is not desired, you need to set
use_sticky_edges to False. Consider the following example:
y, x = np.mgrid[:5, 1:6]
poly_coords = [
    (0.25, 2.75), (3.25, 2.75),
    (2.25, 0.75), (0.25, 0.75)
]
fig, (ax1, ax2) = plt.subplots(ncols=2)

# Here we set the stickiness of the axes object...
# ax1 we'll leave as the default, which uses sticky edges
# and we'll turn off stickiness for ax2
ax2.use_sticky_edges = False

for ax, status in zip((ax1, ax2), ('Is', 'Is Not')):
    cells = ax.pcolor(x, y, x+y, cmap='inferno')  # sticky
    ax.add_patch(
        plt.Polygon(poly_coords, color='forestgreen', alpha=0.5)
    )  # not sticky
    ax.margins(x=0.1, y=0.05)
    ax.set_aspect('equal')
    ax.set_title('{} Sticky'.format(status))

plt.show()
References
The use of the following functions, methods is shown in this example:
Keywords: matplotlib code example, codex, python plot, pyplot Gallery generated by Sphinx-Gallery