Note
Click here to download the full example code
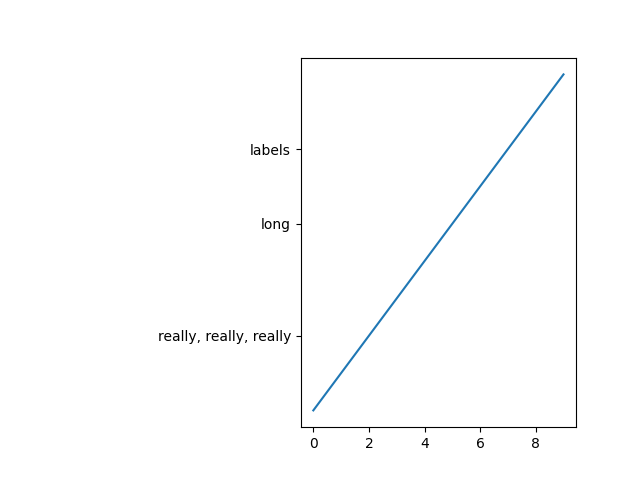
Auto Subplots Adjust
Automatically adjust subplot parameters. This example shows a way to determine a subplot parameter from the extent of the ticklabels using a callback on the draw_event.
Note that a similar result would be achieved using tight_layout
or set_constrained_layout; this example shows how one could
customize the subplot parameter adjustment.
import matplotlib.pyplot as plt
import matplotlib.transforms as mtransforms

fig, ax = plt.subplots()
ax.plot(range(10))
ax.set_yticks((2, 5, 7))
labels = ax.set_yticklabels(('really, really, really', 'long', 'labels'))

def on_draw(event):
    bboxes = []
    for label in labels:
        bbox = label.get_window_extent()
        # the figure transform goes from relative coords->pixels and we
        # want the inverse of that
        bboxi = bbox.inverse_transformed(fig.transFigure)
        bboxes.append(bboxi)

        # this is the bbox that bounds all the bboxes, again in relative
        # figure coords
        bbox = mtransforms.Bbox.union(bboxes)
        if fig.subplotpars.left < bbox.width:
            # we need to move it over
            fig.subplots_adjust(left=1.1*bbox.width)  # pad a little
            fig.canvas.draw()

fig.canvas.mpl_connect('draw_event', on_draw)

plt.show()
References
The use of the following functions, methods, classes and modules is shown in this example:
Out:
<function FigureCanvasBase.mpl_connect at 0x7fdbd5d97160>
Keywords: matplotlib code example, codex, python plot, pyplot Gallery generated by Sphinx-Gallery