Note
Click here to download the full example code
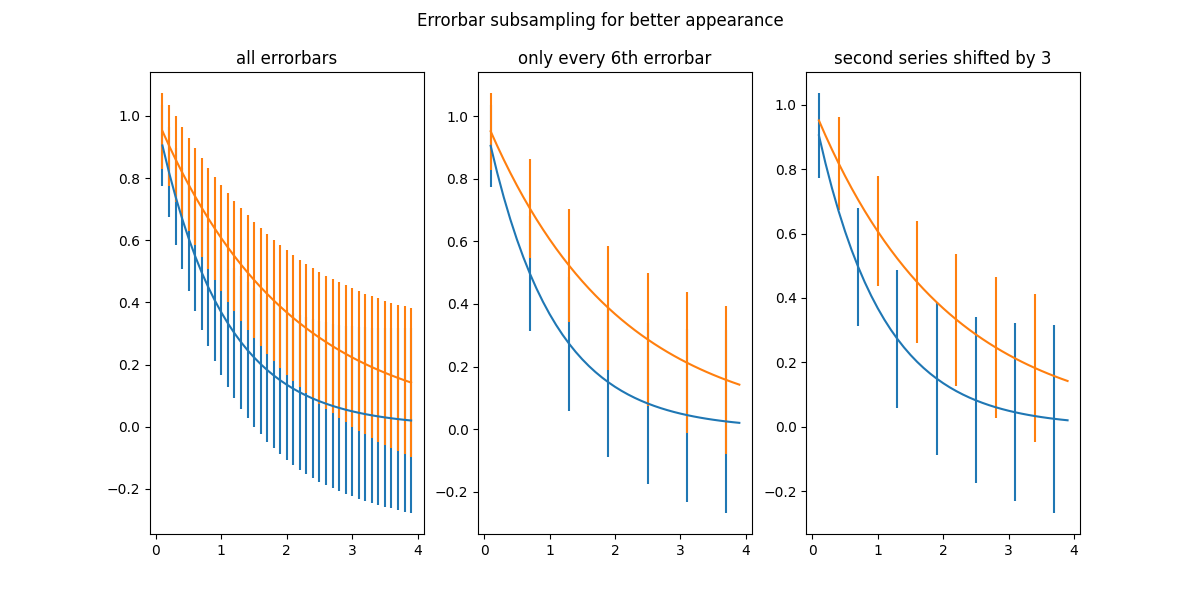
Errorbar Subsample
Demo for the errorevery keyword to show data full accuracy data plots with few errorbars.
import numpy as np
import matplotlib.pyplot as plt

# example data
x = np.arange(0.1, 4, 0.1)
y1 = np.exp(-1.0 * x)
y2 = np.exp(-0.5 * x)

# example variable error bar values
y1err = 0.1 + 0.1 * np.sqrt(x)
y2err = 0.1 + 0.1 * np.sqrt(x/2)


# Now switch to a more OO interface to exercise more features.
fig, (ax_l, ax_c, ax_r) = plt.subplots(nrows=1, ncols=3,
                                       sharex=True, figsize=(12, 6))

ax_l.set_title('all errorbars')
ax_l.errorbar(x, y1, yerr=y1err)
ax_l.errorbar(x, y2, yerr=y2err)

ax_c.set_title('only every 6th errorbar')
ax_c.errorbar(x, y1, yerr=y1err, errorevery=6)
ax_c.errorbar(x, y2, yerr=y2err, errorevery=6)

ax_r.set_title('second series shifted by 3')
ax_r.errorbar(x, y1, yerr=y1err, errorevery=(0, 6))
ax_r.errorbar(x, y2, yerr=y2err, errorevery=(3, 6))

fig.suptitle('Errorbar subsampling for better appearance')
plt.show()
Keywords: matplotlib code example, codex, python plot, pyplot Gallery generated by Sphinx-Gallery