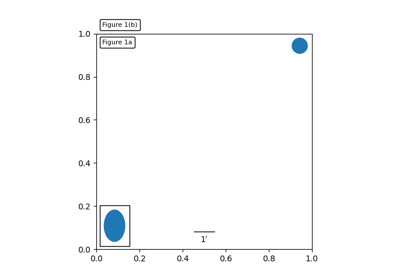
mpl_toolkits.axes_grid1.anchored_artists.AnchoredDrawingArea
-
class
mpl_toolkits.axes_grid1.anchored_artists.AnchoredDrawingArea(width, height, xdescent, ydescent, loc, pad=0.4, borderpad=0.5, prop=None, frameon=True, **kwargs)[source]¶ Bases:
matplotlib.offsetbox.AnchoredOffsetboxAn anchored container with a fixed size and fillable DrawingArea.
Artists added to the drawing_area will have their coordinates interpreted as pixels. Any transformations set on the artists will be overridden.
Parameters: - width, heightint or float
width and height of the container, in pixels.
- xdescent, ydescentint or float
descent of the container in the x- and y- direction, in pixels.
- locint
Location of this artist. Valid location codes are:
'upper right'  : 1,
'upper left'   : 2,
'lower left'   : 3,
'lower right'  : 4,
'right'        : 5,
'center left'  : 6,
'center right' : 7,
'lower center' : 8,
'upper center' : 9,
'center'       : 10
- padint or float, optional
Padding around the child objects, in fraction of the font size. Defaults to 0.4.
- borderpadint or float, optional
Border padding, in fraction of the font size. Defaults to 0.5.
- prop
matplotlib.font_manager.FontProperties, optional Font property used as a reference for paddings.
- frameonbool, optional
If True, draw a box around this artists. Defaults to True.
- **kwargs
Keyworded arguments to pass to
matplotlib.offsetbox.AnchoredOffsetbox.
Examples
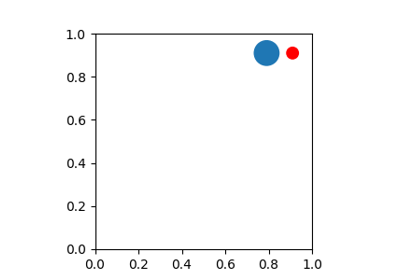
To display blue and red circles of different sizes in the upper right of an axes ax:
>>> ada = AnchoredDrawingArea(20, 20, 0, 0,
...                           loc='upper right', frameon=False)
>>> ada.drawing_area.add_artist(Circle((10, 10), 10, fc="b"))
>>> ada.drawing_area.add_artist(Circle((30, 10), 5, fc="r"))
>>> ax.add_artist(ada)
Attributes: - drawing_area
matplotlib.offsetbox.DrawingArea A container for artists to display.