matplotlib.pyplot.acorr
-
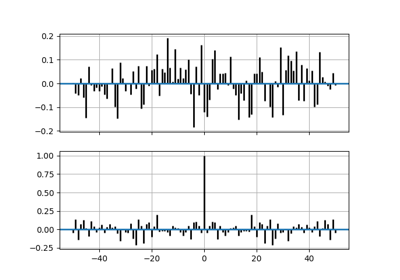
matplotlib.pyplot.acorr(x, \*, data=None, \*\*kwargs)[source]¶ Plot the autocorrelation of x.
Parameters: - xarray-like
- detrendcallable, optional, default:
mlab.detrend_none x is detrended by the detrend callable. This must be a function
x = detrend(x)accepting and returning annumpy.array. Default is no normalization.- normedbool, optional, default: True
If
True, input vectors are normalised to unit length.- usevlinesbool, optional, default: True
Determines the plot style.
If
True, vertical lines are plotted from 0 to the acorr value usingAxes.vlines. Additionally, a horizontal line is plotted at y=0 usingAxes.axhline.If
False, markers are plotted at the acorr values usingAxes.plot.- maxlagsint, optional, default: 10
Number of lags to show. If
None, will return all2 * len(x) - 1lags.
Returns: - lagsarray (length
2*maxlags+1) The lag vector.
- carray (length
2*maxlags+1) The auto correlation vector.
- line
LineCollectionorLine2D Artistadded to the axes of the correlation:LineCollectionif usevlines is True.Line2Dif usevlines is False.
- b
Line2Dor None Horizontal line at 0 if usevlines is True None usevlines is False.
Other Parameters: - linestyle
Line2Dproperty, optional The linestyle for plotting the data points. Only used if usevlines is
False.- markerstr, optional, default: 'o'
The marker for plotting the data points. Only used if usevlines is
False.
Notes
The cross correlation is performed with
numpy.correlate()withmode = "full".Note
In addition to the above described arguments, this function can take a data keyword argument. If such a data argument is given, the following arguments are replaced by data[<arg>]:
- All arguments with the following names: 'x'.
Objects passed as data must support item access (
data[<arg>]) and membership test (<arg> in data).