John Hunter Excellence in Plotting Contest 2020 submissions are open! Entries are due June 1, 2020.
matplotlib.axis
matplotlib.axis.XAxis.set_major_formatter
XAxis.
set_major_formatter
Set the formatter of the major ticker.
Formatter
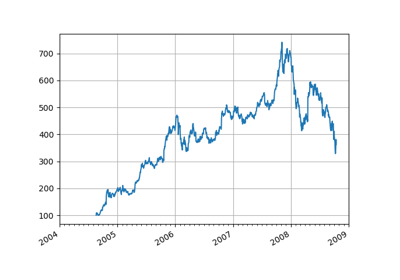
Date tick labels
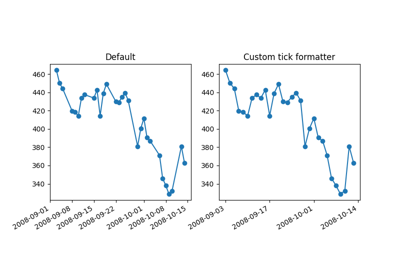
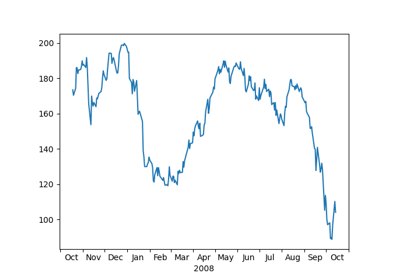
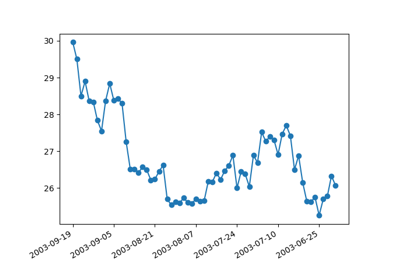
Custom tick formatter for time series
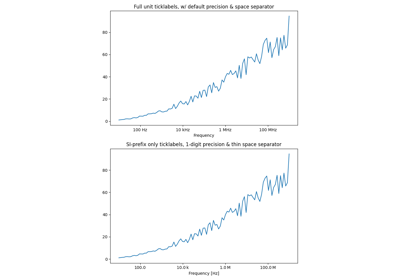
Labeling ticks using engineering notation
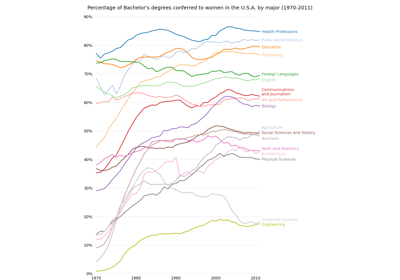
Bachelor's degrees by gender
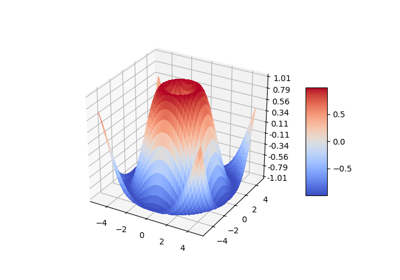
3D surface (color map)
Centering labels between ticks
Formatting date ticks using ConciseDateFormatter
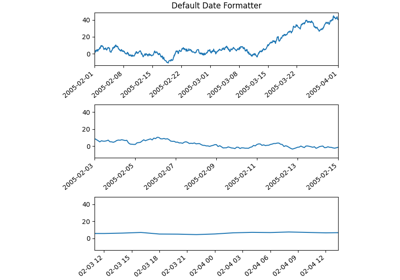
Date Demo Convert
Date Demo Rrule
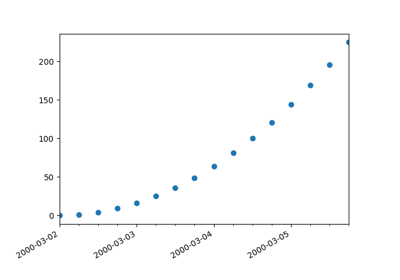
Date Index Formatter
Major and minor ticks
Setting tick labels from a list of values
The Lifecycle of a Plot
Choosing Colormaps in Matplotlib
Text in Matplotlib Plots