John Hunter Excellence in Plotting Contest 2020 submissions are open! Entries are due June 1, 2020.
matplotlib.axes
matplotlib.axes.Axes.set
Axes.
set
A property batch setter. Pass kwargs to set properties.
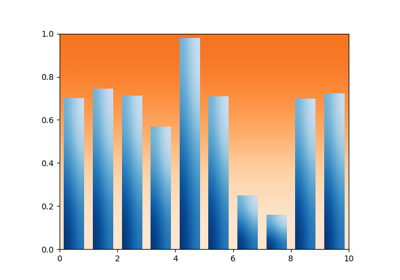
Bar chart with gradients
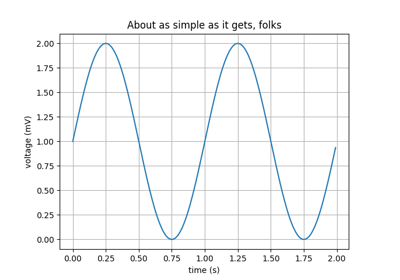
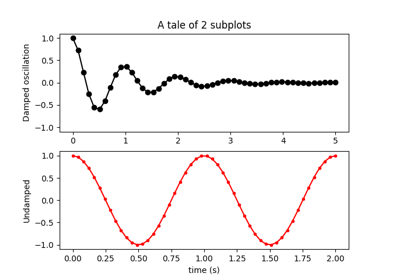
Simple Plot
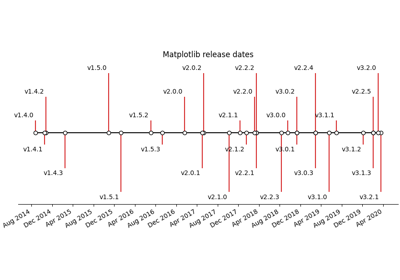
Creating a timeline with lines, dates, and text
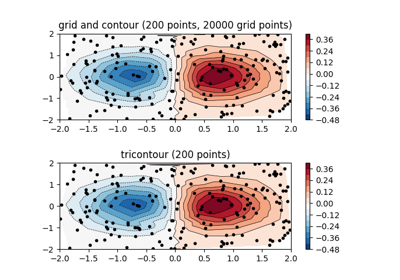
Contour plot of irregularly spaced data
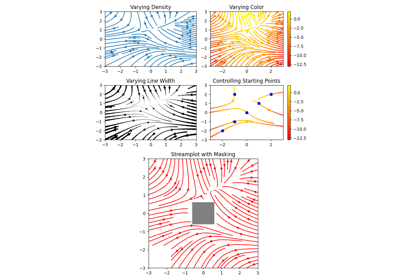
Streamplot
Basic Subplot Demo
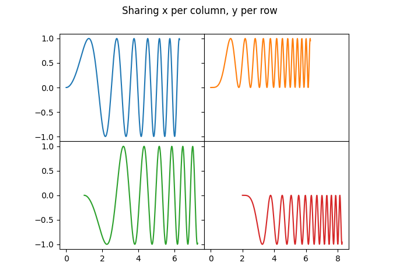
Creating multiple subplots using plt.subplots
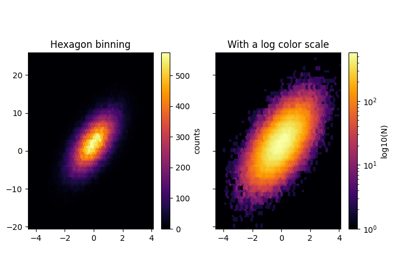
Hexbin Demo
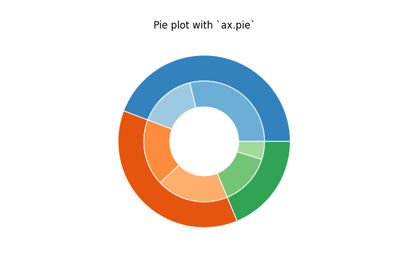
Nested pie charts
Annotating Plots
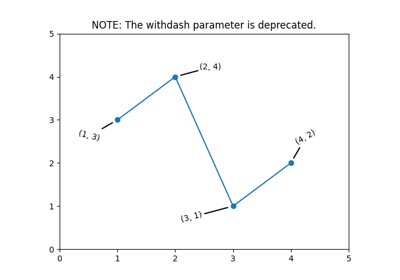
Dashpoint Label
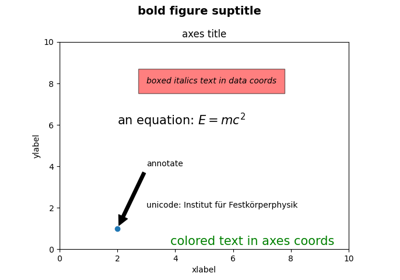
Text Commands
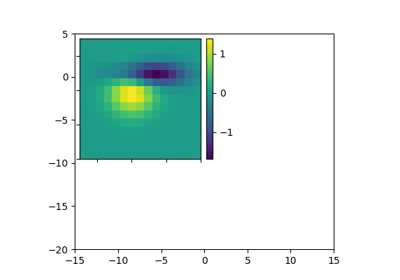
Demo Colorbar of Inset Axes
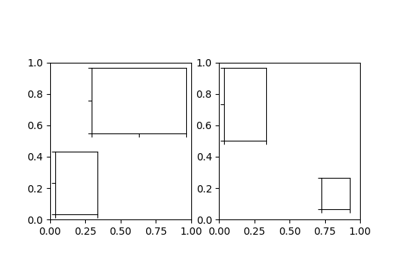
Inset Locator Demo
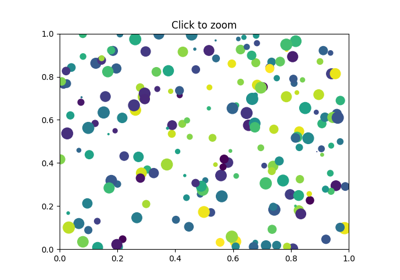
Zoom Window
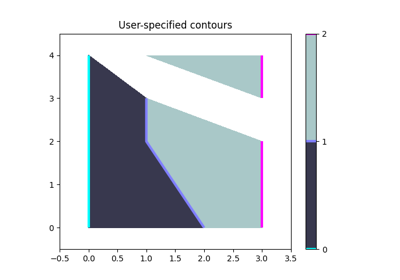
Manual Contour
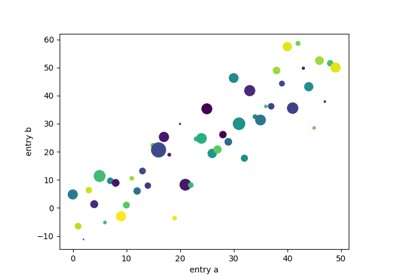
Plotting with keywords
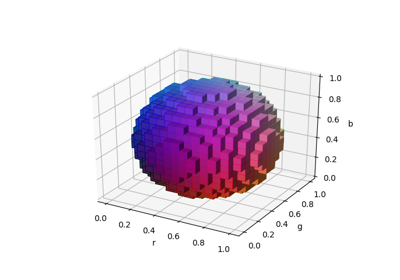
3D voxel / volumetric plot with rgb colors
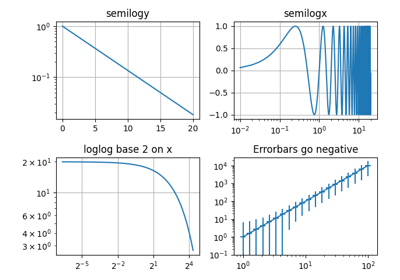
Log Demo
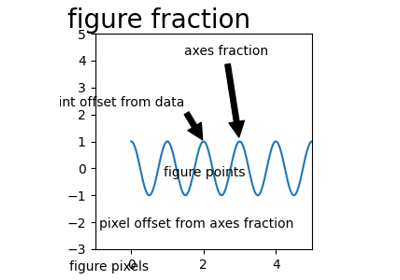
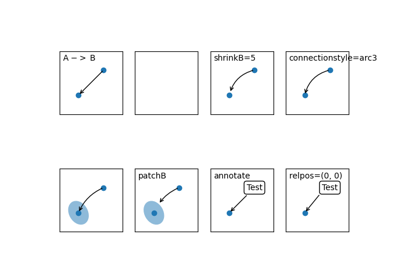
Annotate Explain
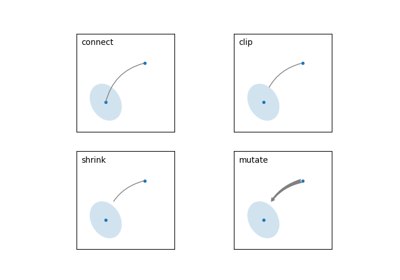
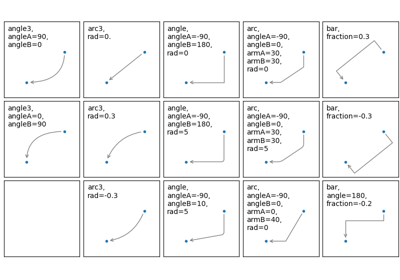
Connectionstyle Demo
Simple Annotate01
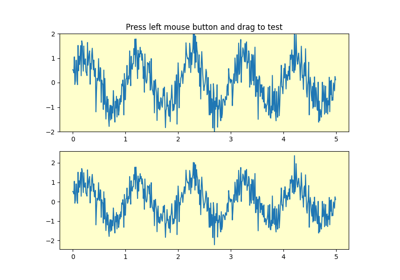
Span Selector
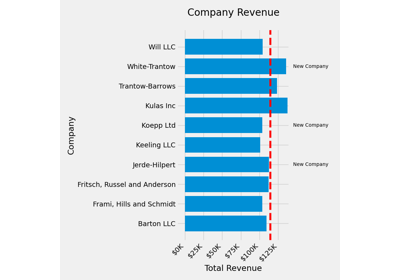
The Lifecycle of a Plot