Note
Click here to download the full example code
Resizing axes with constrained layout
Constrained layout attempts to resize subplots in a figure so that there are no overlaps between axes objects and labels on the axes.
See Constrained Layout Guide for more details and Tight Layout guide for an alternative.
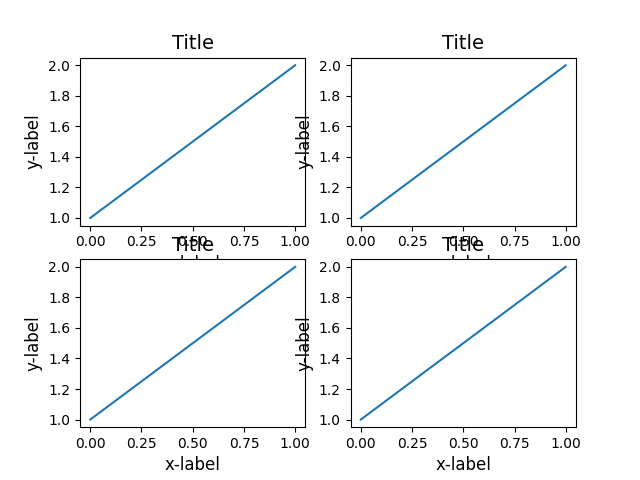
If we don't use constrained_layout, then labels overlap the axes
fig, axs = plt.subplots(nrows=2, ncols=2, constrained_layout=False)

for ax in axs.flat:
    example_plot(ax)
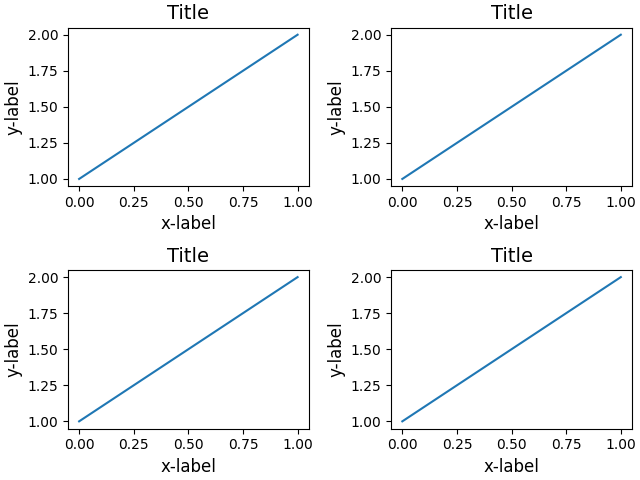
adding constrained_layout=True automatically adjusts.
fig, axs = plt.subplots(nrows=2, ncols=2, constrained_layout=True)

for ax in axs.flat:
    example_plot(ax)
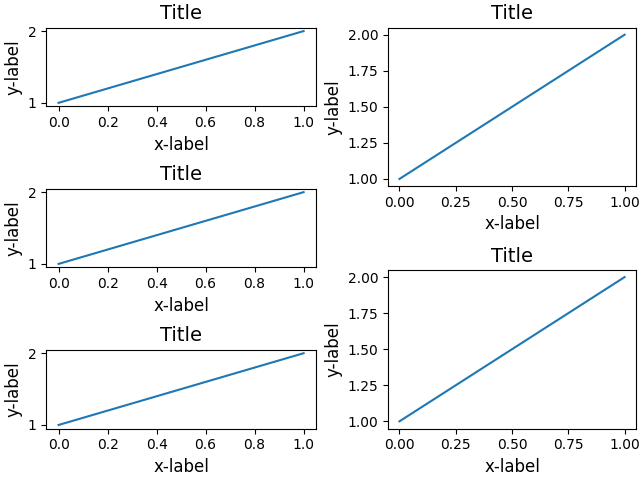
Below is a more complicated example using nested gridspecs.
fig = plt.figure(constrained_layout=True)

import matplotlib.gridspec as gridspec

gs0 = gridspec.GridSpec(1, 2, figure=fig)

gs1 = gridspec.GridSpecFromSubplotSpec(3, 1, subplot_spec=gs0[0])
for n in range(3):
    ax = fig.add_subplot(gs1[n])
    example_plot(ax)


gs2 = gridspec.GridSpecFromSubplotSpec(2, 1, subplot_spec=gs0[1])
for n in range(2):
    ax = fig.add_subplot(gs2[n])
    example_plot(ax)

plt.show()
References
The use of the following functions and methods is shown in this example:
import matplotlib
matplotlib.gridspec.GridSpec
matplotlib.gridspec.GridSpecFromSubplotSpec
Keywords: matplotlib code example, codex, python plot, pyplot Gallery generated by Sphinx-Gallery