Note
Click here to download the full example code
Placing Colorbars
Colorbars indicate the quantitative extent of image data. Placing in a figure is non-trivial because room needs to be made for them.
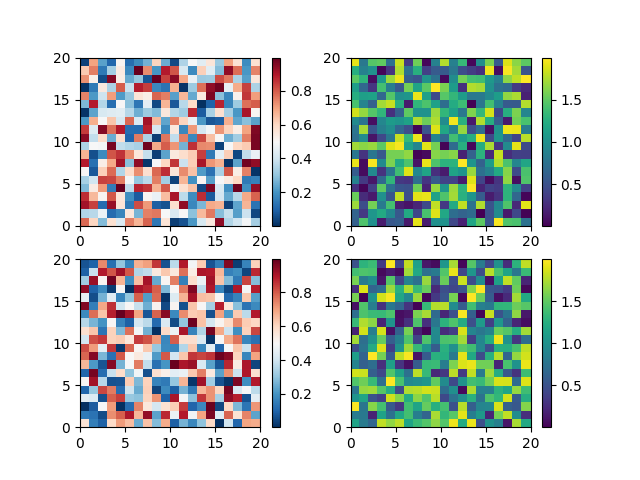
The simplest case is just attaching a colorbar to each axes:
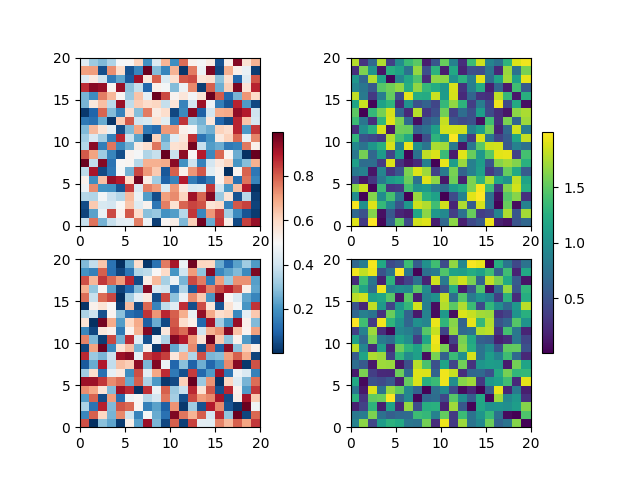
The first column has the same type of data in both rows, so it may
be desirable to combine the colorbar which we do by calling
Figure.colorbar with a list of axes instead of a single axes.
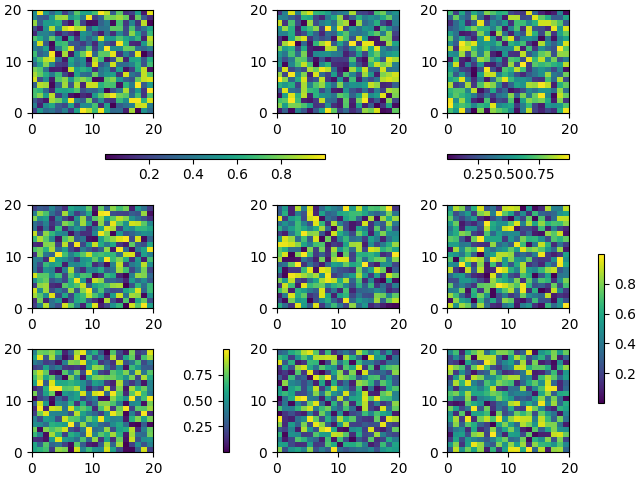
Relatively complicated colorbar layouts are possible using this
paradigm. Note that this example works far better with
constrained_layout=True
fig, axs = plt.subplots(3, 3, constrained_layout=True)
for ax in axs.flat:
    pcm = ax.pcolormesh(np.random.random((20, 20)))

fig.colorbar(pcm, ax=axs[0, :2], shrink=0.6, location='bottom')
fig.colorbar(pcm, ax=[axs[0, 2]], location='bottom')
fig.colorbar(pcm, ax=axs[1:, :], location='right', shrink=0.6)
fig.colorbar(pcm, ax=[axs[2, 1]], location='left')


plt.show()
Total running time of the script: ( 0 minutes 1.160 seconds)
Keywords: matplotlib code example, codex, python plot, pyplot Gallery generated by Sphinx-Gallery