Note
Click here to download the full example code
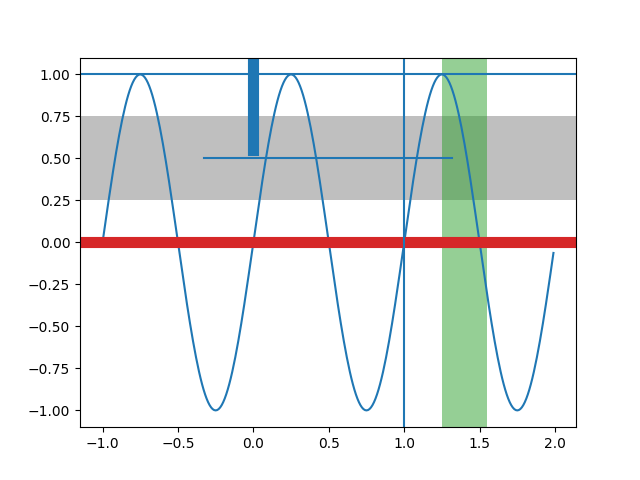
axhspan Demo
Create lines or rectangles that span the axes in either the horizontal or vertical direction.
import numpy as np
import matplotlib.pyplot as plt

t = np.arange(-1, 2, .01)
s = np.sin(2 * np.pi * t)

plt.plot(t, s)
# Draw a thick red hline at y=0 that spans the xrange
plt.axhline(linewidth=8, color='#d62728')

# Draw a default hline at y=1 that spans the xrange
plt.axhline(y=1)

# Draw a default vline at x=1 that spans the yrange
plt.axvline(x=1)

# Draw a thick blue vline at x=0 that spans the upper quadrant of the yrange
plt.axvline(x=0, ymin=0.75, linewidth=8, color='#1f77b4')

# Draw a default hline at y=.5 that spans the middle half of the axes
plt.axhline(y=.5, xmin=0.25, xmax=0.75)

plt.axhspan(0.25, 0.75, facecolor='0.5', alpha=0.5)

plt.axvspan(1.25, 1.55, facecolor='#2ca02c', alpha=0.5)

plt.show()
Keywords: matplotlib code example, codex, python plot, pyplot Gallery generated by Sphinx-Gallery