Note
Click here to download the full example code
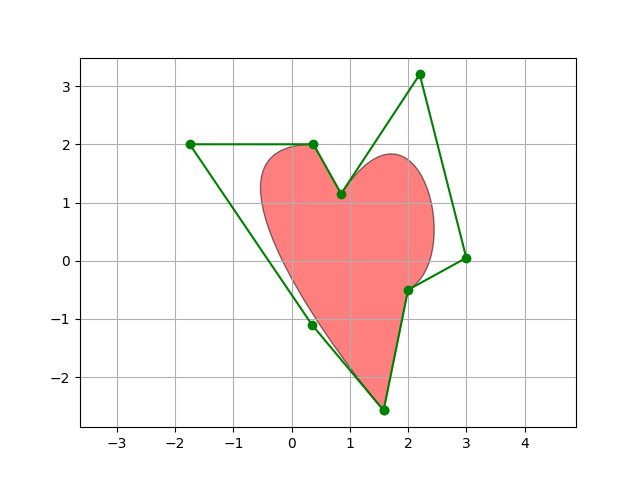
PathPatch object
This example shows how to create Path and PathPatch objects through
Matplotlib's API.
import matplotlib.path as mpath
import matplotlib.patches as mpatches
import matplotlib.pyplot as plt


fig, ax = plt.subplots()

Path = mpath.Path
path_data = [
    (Path.MOVETO, (1.58, -2.57)),
    (Path.CURVE4, (0.35, -1.1)),
    (Path.CURVE4, (-1.75, 2.0)),
    (Path.CURVE4, (0.375, 2.0)),
    (Path.LINETO, (0.85, 1.15)),
    (Path.CURVE4, (2.2, 3.2)),
    (Path.CURVE4, (3, 0.05)),
    (Path.CURVE4, (2.0, -0.5)),
    (Path.CLOSEPOLY, (1.58, -2.57)),
    ]
codes, verts = zip(*path_data)
path = mpath.Path(verts, codes)
patch = mpatches.PathPatch(path, facecolor='r', alpha=0.5)
ax.add_patch(patch)

# plot control points and connecting lines
x, y = zip(*path.vertices)
line, = ax.plot(x, y, 'go-')

ax.grid()
ax.axis('equal')
plt.show()
References
The use of the following functions, methods, classes and modules is shown in this example:
import matplotlib
matplotlib.path
matplotlib.path.Path
matplotlib.patches
matplotlib.patches.PathPatch
matplotlib.axes.Axes.add_patch
Out:
<function _AxesBase.add_patch at 0x7f154d18adc0>
Keywords: matplotlib code example, codex, python plot, pyplot Gallery generated by Sphinx-Gallery