Note
Click here to download the full example code
Easily creating subplots
In early versions of matplotlib, if you wanted to use the pythonic API and create a figure instance and from that create a grid of subplots, possibly with shared axes, it involved a fair amount of boilerplate code. e.g.
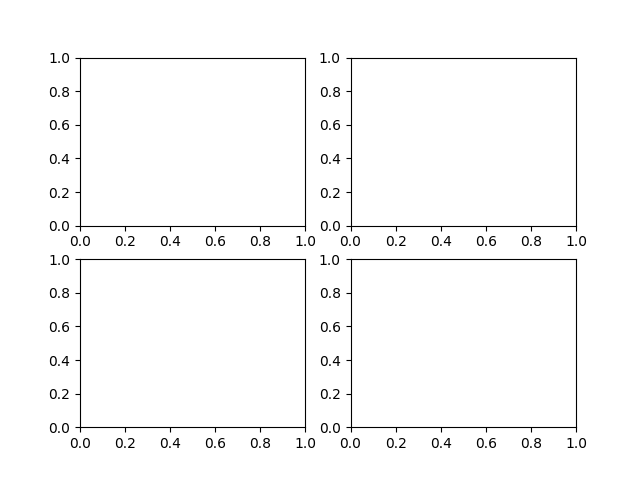
Fernando Perez has provided a nice top level method in
subplots() (note the "s" at the end) to create
everything at once, and turn on x and y sharing for the whole bunch.
You can either unpack the axes individually...
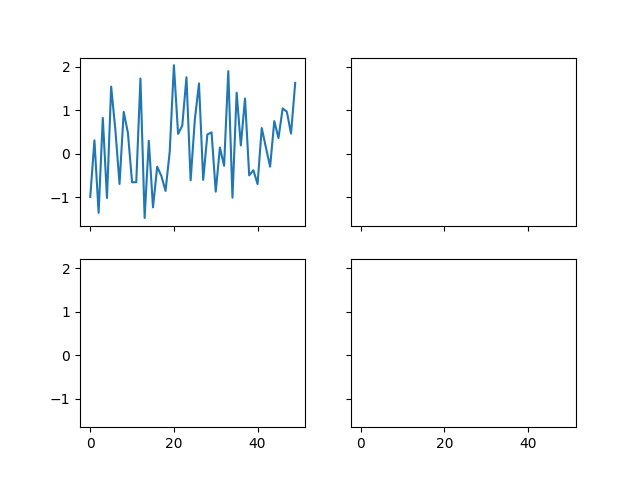
Out:
[<matplotlib.lines.Line2D object at 0x7f155a15e7c0>]
or get them back as a numrows x numcolumns object array which supports numpy indexing

Keywords: matplotlib code example, codex, python plot, pyplot Gallery generated by Sphinx-Gallery