Note
Click here to download the full example code
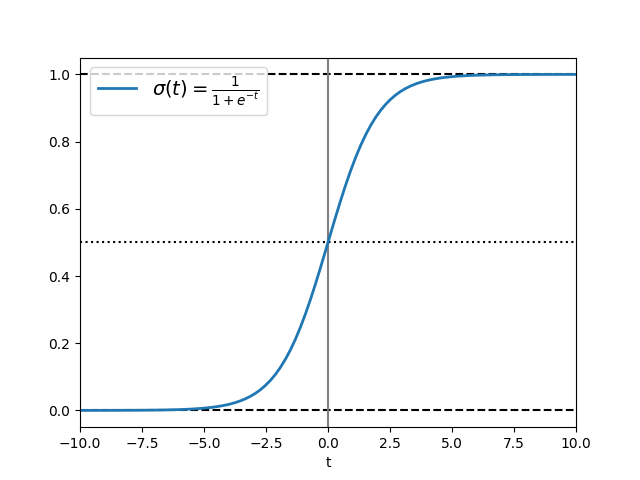
Infinite horizontal and vertical lines
axvline and axhline draw infinite vertical /
horizontal lines, at given x / y positions. They are usually used to mark
special data values, e.g. in this example the center and limit values of the
sigmoid function.
import numpy as np
import matplotlib.pyplot as plt

t = np.linspace(-10, 10, 100)
sig = 1 / (1 + np.exp(-t))

plt.axhline(y=0, color="black", linestyle="--")
plt.axhline(y=0.5, color="black", linestyle=":")
plt.axhline(y=1.0, color="black", linestyle="--")
plt.axvline(color="grey")
plt.plot(t, sig, linewidth=2, label=r"$\sigma(t) = \frac{1}{1 + e^{-t}}$")
plt.xlim(-10, 10)
plt.xlabel("t")
plt.legend(fontsize=14)
plt.show()
References
The use of the following functions, methods, classes and modules is shown in this example:
import matplotlib
matplotlib.pyplot.axhline
matplotlib.pyplot.axvline
matplotlib.axes.Axes.axhline
matplotlib.axes.Axes.axvline
Out:
<function Axes.axvline at 0x7f154d199040>
Keywords: matplotlib code example, codex, python plot, pyplot Gallery generated by Sphinx-Gallery