Note
Click here to download the full example code
Stem Plot
stem plots vertical lines from a baseline to the y-coordinate and
places a marker at the tip.
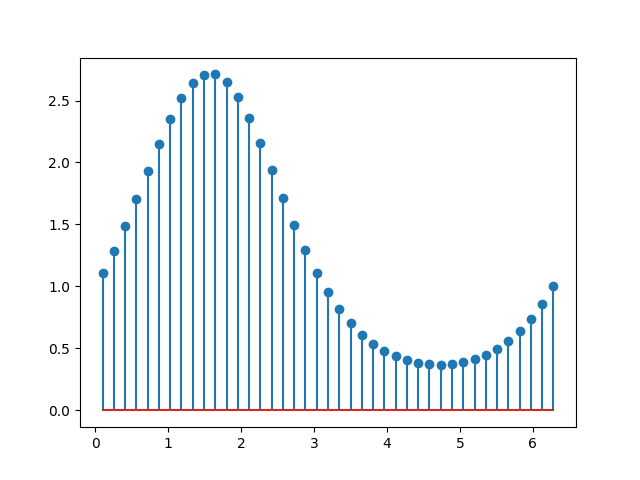
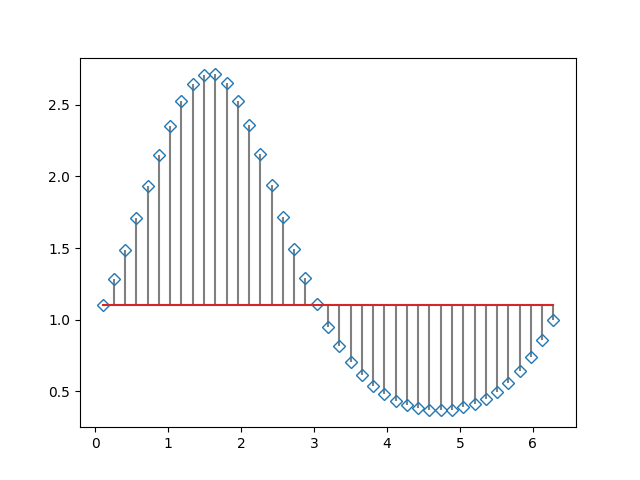
The position of the baseline can be adapted using bottom.
The parameters linefmt, markerfmt, and basefmt control basic format
properties of the plot. However, in contrast to plot not all
properties are configurable via keyword arguments. For more advanced
control adapt the line objects returned by pyplot.
markerline, stemlines, baseline = plt.stem(
    x, y, linefmt='grey', markerfmt='D', bottom=1.1, use_line_collection=True)
markerline.set_markerfacecolor('none')
plt.show()
References
The use of the following functions, methods, classes and modules is shown in this example:
import matplotlib
matplotlib.pyplot.stem
matplotlib.axes.Axes.stem
Out:
<function Axes.stem at 0x7f154d199f70>
Keywords: matplotlib code example, codex, python plot, pyplot Gallery generated by Sphinx-Gallery