Note
Click here to download the full example code
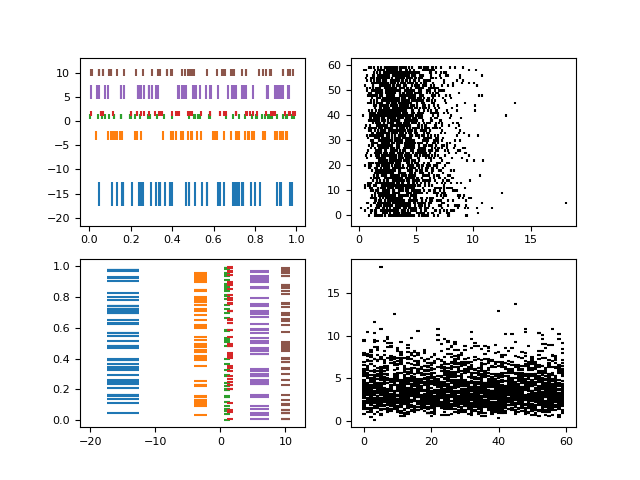
Eventplot Demo
An eventplot showing sequences of events with various line properties. The plot is shown in both horizontal and vertical orientations.
import matplotlib.pyplot as plt
import numpy as np
import matplotlib
matplotlib.rcParams['font.size'] = 8.0

# Fixing random state for reproducibility
np.random.seed(19680801)


# create random data
data1 = np.random.random([6, 50])

# set different colors for each set of positions
colors1 = ['C{}'.format(i) for i in range(6)]

# set different line properties for each set of positions
# note that some overlap
lineoffsets1 = np.array([-15, -3, 1, 1.5, 6, 10])
linelengths1 = [5, 2, 1, 1, 3, 1.5]

fig, axs = plt.subplots(2, 2)

# create a horizontal plot
axs[0, 0].eventplot(data1, colors=colors1, lineoffsets=lineoffsets1,
                    linelengths=linelengths1)

# create a vertical plot
axs[1, 0].eventplot(data1, colors=colors1, lineoffsets=lineoffsets1,
                    linelengths=linelengths1, orientation='vertical')

# create another set of random data.
# the gamma distribution is only used fo aesthetic purposes
data2 = np.random.gamma(4, size=[60, 50])

# use individual values for the parameters this time
# these values will be used for all data sets (except lineoffsets2, which
# sets the increment between each data set in this usage)
colors2 = 'black'
lineoffsets2 = 1
linelengths2 = 1

# create a horizontal plot
axs[0, 1].eventplot(data2, colors=colors2, lineoffsets=lineoffsets2,
                    linelengths=linelengths2)


# create a vertical plot
axs[1, 1].eventplot(data2, colors=colors2, lineoffsets=lineoffsets2,
                    linelengths=linelengths2, orientation='vertical')

plt.show()
Keywords: matplotlib code example, codex, python plot, pyplot Gallery generated by Sphinx-Gallery