Note
Click here to download the full example code
Color Demo
Matplotlib recognizes the following formats to specify a color:
- an RGB or RGBA tuple of float values in
[0, 1](e.g.(0.1, 0.2, 0.5)or(0.1, 0.2, 0.5, 0.3)). RGBA is short for Red, Green, Blue, Alpha; - a hex RGB or RGBA string (e.g.,
'#0F0F0F'or'#0F0F0F0F'); - a string representation of a float value in
[0, 1]inclusive for gray level (e.g.,'0.5'); - a single letter string, i.e. one of
{'b', 'g', 'r', 'c', 'm', 'y', 'k', 'w'}; - a X11/CSS4 ("html") color name, e.g.
"blue"; - a name from the xkcd color survey,
prefixed with
'xkcd:'(e.g.,'xkcd:sky blue'); - a "Cn" color spec, i.e.
'C'followed by a number, which is an index into the default property cycle (matplotlib.rcParams['axes.prop_cycle']); the indexing is intended to occur at rendering time, and defaults to black if the cycle does not include color. - one of
{'tab:blue', 'tab:orange', 'tab:green',
'tab:red', 'tab:purple', 'tab:brown', 'tab:pink',
'tab:gray', 'tab:olive', 'tab:cyan'}
which are the Tableau Colors from the 'tab10' categorical palette (which is the default color cycle);
For more information on colors in matplotlib see
- the Specifying Colors tutorial;
- the
matplotlib.colorsAPI; - the List of named colors example.
import matplotlib.pyplot as plt
import numpy as np
t = np.linspace(0.0, 2.0, 201)
s = np.sin(2 * np.pi * t)
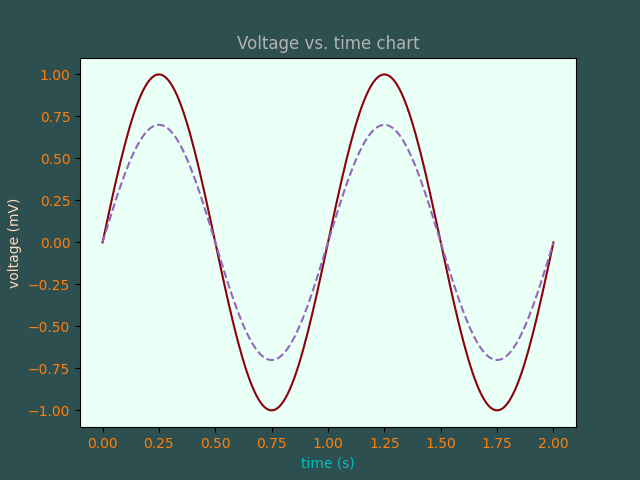
# 1) RGB tuple:
fig, ax = plt.subplots(facecolor=(.18, .31, .31))
# 2) hex string:
ax.set_facecolor('#eafff5')
# 3) gray level string:
ax.set_title('Voltage vs. time chart', color='0.7')
# 4) single letter color string
ax.set_xlabel('time (s)', color='c')
# 5) a named color:
ax.set_ylabel('voltage (mV)', color='peachpuff')
# 6) a named xkcd color:
ax.plot(t, s, 'xkcd:crimson')
# 7) Cn notation:
ax.plot(t, .7*s, color='C4', linestyle='--')
# 8) tab notation:
ax.tick_params(labelcolor='tab:orange')
plt.show()
References
The use of the following functions, methods, classes and modules is shown in this example:
import matplotlib
matplotlib.colors
matplotlib.axes.Axes.plot
matplotlib.axes.Axes.set_facecolor
matplotlib.axes.Axes.set_title
matplotlib.axes.Axes.set_xlabel
matplotlib.axes.Axes.set_ylabel
matplotlib.axes.Axes.tick_params
Out:
<function _AxesBase.tick_params at 0x7f154d18c4c0>
Keywords: matplotlib code example, codex, python plot, pyplot Gallery generated by Sphinx-Gallery