matplotlib.pyplot.tight_layout
-
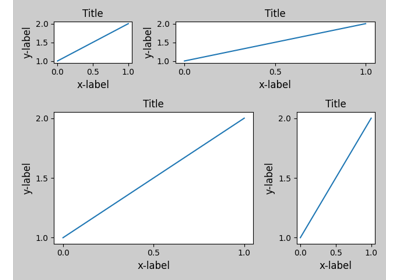
matplotlib.pyplot.tight_layout(pad=1.08, h_pad=None, w_pad=None, rect=None)[source]¶ Automatically adjust subplot parameters to give specified padding.
Parameters: - padfloat
Padding between the figure edge and the edges of subplots, as a fraction of the font size.
- h_pad, w_padfloat, optional
Padding (height/width) between edges of adjacent subplots, as a fraction of the font size. Defaults to pad.
- recttuple (left, bottom, right, top), optional
A rectangle (left, bottom, right, top) in the normalized figure coordinate that the whole subplots area (including labels) will fit into. Default is (0, 0, 1, 1).