matplotlib.pyplot.text
-
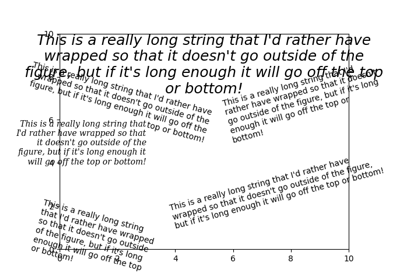
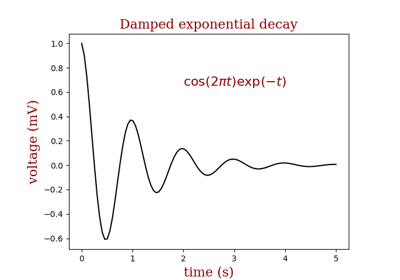
matplotlib.pyplot.text(x, y, s, fontdict=None, withdash=<deprecated parameter>, **kwargs)[source]¶ Add text to the axes.
Add the text s to the axes at location x, y in data coordinates.
Parameters: - x, yscalars
The position to place the text. By default, this is in data coordinates. The coordinate system can be changed using the transform parameter.
- sstr
The text.
- fontdictdictionary, optional, default: None
A dictionary to override the default text properties. If fontdict is None, the defaults are determined by your rc parameters.
- withdashboolean, optional, default: False
Creates a
TextWithDashinstance instead of aTextinstance.
Returns: Other Parameters: - **kwargs
Textproperties. Other miscellaneous text parameters.
Examples
Individual keyword arguments can be used to override any given parameter:
>>> text(x, y, s, fontsize=12)
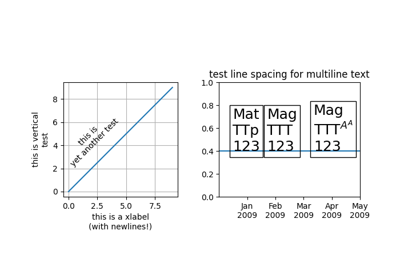
The default transform specifies that text is in data coords, alternatively, you can specify text in axis coords ((0, 0) is lower-left and (1, 1) is upper-right). The example below places text in the center of the axes:
>>> text(0.5, 0.5, 'matplotlib', horizontalalignment='center',
...      verticalalignment='center', transform=ax.transAxes)
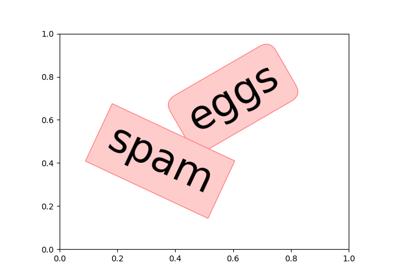
You can put a rectangular box around the text instance (e.g., to set a background color) by using the keyword bbox. bbox is a dictionary of
Rectangleproperties. For example:>>> text(x, y, s, bbox=dict(facecolor='red', alpha=0.5))