matplotlib.axes.Axes.hlines
-
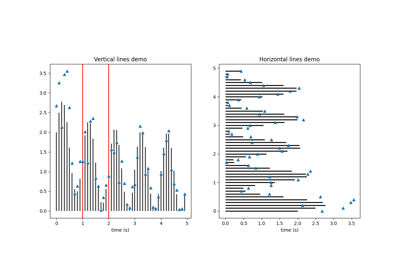
Axes.hlines(self, y, xmin, xmax, colors='k', linestyles='solid', label='', *, data=None, **kwargs)[source]¶ Plot horizontal lines at each y from xmin to xmax.
Parameters: - yscalar or sequence of scalar
y-indexes where to plot the lines.
- xmin, xmaxscalar or 1D array-like
Respective beginning and end of each line. If scalars are provided, all lines will have same length.
- colorsarray-like of colors, optional, default: 'k'
- linestyles{'solid', 'dashed', 'dashdot', 'dotted'}, optional
- labelstr, optional, default: ''
Returns: - lines
LineCollection
Other Parameters: - **kwargs
LineCollectionproperties.
Notes
Note
In addition to the above described arguments, this function can take a data keyword argument. If such a data argument is given, the following arguments are replaced by data[<arg>]:
- All arguments with the following names: 'colors', 'xmax', 'xmin', 'y'.
Objects passed as data must support item access (
data[<arg>]) and membership test (<arg> in data).