Version 3.1.3
Note
matplotlib 2.0 supports Python 2.7, and 3.4+
The major changes in v2.0 are related to overhauling the default styles.
The colors gained a new color conversion API with
full support for the alpha channel. The main public functions are
is_color_like(), matplotlib.colors.to_rgba(),
matplotlib.colors.to_rgba_array() and to_hex().
RGBA quadruplets are encoded in hex format as #rrggbbaa.
A side benefit is that the Qt options editor now allows setting the alpha channel of the artists as well.
New rcparams added
| Parameter | Description |
|---|---|
date.autoformatter.year |
format string for 'year' scale dates |
date.autoformatter.month |
format string for 'month' scale dates |
date.autoformatter.day |
format string for 'day' scale dates |
date.autoformatter.hour |
format string for 'hour' scale times |
date.autoformatter.minute |
format string for 'minute' scale times |
date.autoformatter.second |
format string for 'second' scale times |
date.autoformatter.microsecond |
format string for 'microsecond' scale times |
scatter.marker |
default marker for scatter plot |
svg.hashsalt |
see note |
xtick.top, xtick.minor.top,
xtick.major.top
xtick.bottom,
xtick.minor.bottom,
xtick.major.bottom
ytick.left, ytick.minor.left,
ytick.major.left
ytick.right,
ytick.minor.right,
ytick.major.right |
Control where major and minor ticks are drawn.
The global values are and ed with the
corresponding major/minor values. |
hist.bins |
The default number of bins to use in
hist. This can be an
int, a list of floats, or 'auto' if numpy
>= 1.11 is installed. |
lines.scale_dashes |
Whether the line dash patterns should scale with linewidth. |
axes.formatter.offset_threshold |
Minimum number of digits saved in tick labels that triggers using an offset. |
svg.hashsalt key to rcParams¶If svg.hashsalt is None (which it is by default), the svg
backend uses uuid4 to generate the hash salt. If it is not
None, it must be a string that is used as the hash salt instead of
uuid4. This allows for deterministic SVG output.
svg.image_noscale rcParam¶As a result of the extensive changes to image handling, the
svg.image_noscale rcParam has been removed. The same
functionality may be achieved by setting interpolation='none' on
individual images or globally using the image.interpolation
rcParam.
ColorBrewer's "qualitative" colormaps ("Accent", "Dark2", "Paired",
"Pastel1", "Pastel2", "Set1", "Set2", "Set3") were intended for discrete
categorical data, with no implication of value, and therefore have been
converted to ListedColormap instead of LinearSegmentedColormap, so
the colors will no longer be interpolated and they can be used for
choropleths, labeled image features, etc.
labelcolor¶Axis offset labels are now colored the same as axis tick markers when labelcolor is altered.
The default offset-text choice was changed to only use significant digits that are common to all ticks (e.g. 1231..1239 -> 1230, instead of 1231), except when they straddle a relatively large multiple of a power of ten, in which case that multiple is chosen (e.g. 1999..2001->2000).
In order to prevent unexpected consequences from using a style, style files are no longer able to set parameters that affect things unrelated to style. These parameters include:
'interactive', 'backend', 'backend.qt4', 'webagg.port',
'webagg.port_retries', 'webagg.open_in_browser', 'backend_fallback',
'toolbar', 'timezone', 'datapath', 'figure.max_open_warning',
'savefig.directory', 'tk.window_focus', 'docstring.hardcopy'
The default font used by matplotlib in text has been changed to DejaVu Sans and DejaVu Serif for the sans-serif and serif families, respectively. The DejaVu font family is based on the previous matplotlib default --Bitstream Vera-- but includes a much wider range of characters.
The default mathtext font has been changed from Computer Modern to the DejaVu
family to maintain consistency with regular text. Two new options for the
mathtext.fontset configuration parameter have been added: dejavusans
(default) and dejavuserif. Both of these options use DejaVu glyphs whenever
possible and fall back to STIX symbols when a glyph is not found in DejaVu. To
return to the previous behavior, set the rcParam mathtext.fontset to cm.
Rendering text in the Agg backend is now less fuzzy and about 20% faster to draw.
Various usability improvements were implemented for the Qt figure options editor, among which:
Prior to version 2.0, matplotlib resampled images by first applying the color map and then resizing the result. Since the resampling was performed on the colored image, this introduced colors in the output image that didn't actually exist in the color map. Now, images are resampled first (and entirely in floating-point, if the input image is floating-point), and then the color map is applied.
In order to make this important change, the image handling code was almost entirely rewritten. As a side effect, image resampling uses less memory and fewer datatype conversions than before.
The experimental private feature where one could "skew" an image by
setting the private member _image_skew_coordinate has been
removed. Instead, images will obey the transform of the axes on which
they are drawn.
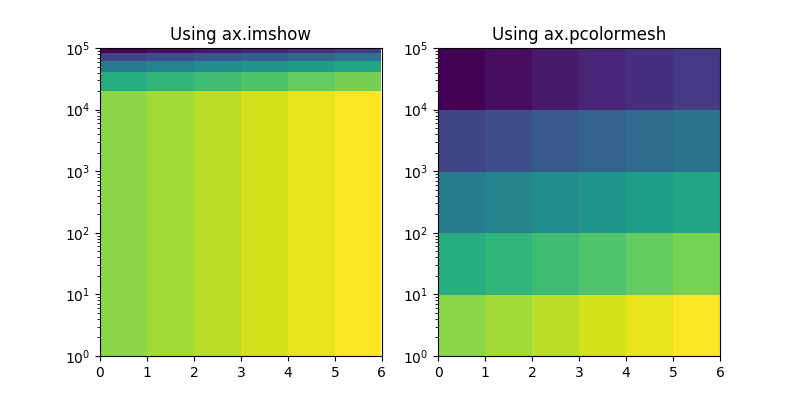
imshow() now draws data at the requested points in data space after the
application of non-linear scales.
The image on the left demonstrates the new, correct behavior.
The old behavior can be recreated using pcolormesh() as
demonstrated on the right.
(Source code, png, pdf)

This can be understood by analogy to plotting a histogram with linearly spaced bins with a logarithmic x-axis. Equal sized bins will be displayed as wider for small x and narrower for large x.
The NbAgg and WebAgg backends will now use the full resolution of your high-pixel-density display.
The default animation codec has been changed from mpeg4 to h264,
which is more efficient. It can be set via the animation.codec rcParam.
The use of mencoder for writing video files with mpl is problematic; switching to ffmpeg is strongly advised. All support for mencoder will be removed in version 2.2.
The zorder parameter now exists for boxplot(). This allows the zorder
of a boxplot to be set in the plotting function call.
boxplot(np.arange(10), zorder=10)
+ and x markers¶New fillable plus and x markers have been added. See
the markers module and
marker reference
examples.
rcount and ccount for plot_surface()¶As of v2.0, mplot3d's plot_surface() now
accepts rcount and ccount arguments for controlling the sampling of the
input data for plotting. These arguments specify the maximum number of
evenly spaced samples to take from the input data. These arguments are
also the new default sampling method for the function, and is
considered a style change.
The old rstride and cstride arguments, which specified the size of the
evenly spaced samples, become the default when 'classic' mode is invoked,
and are still available for use. There are no plans for deprecating these
arguments.
The zorder parameter for streamplot() now has default
value of None instead of 2. If None is given as zorder,
streamplot() has a default zorder of
matplotlib.lines.Line2D.zorder.
matplotlib.backend_bases.GraphicsContextBase¶To support standardizing hatch behavior across the backends we ship
the matplotlib.backend_bases.GraphicsContextBase.get_hatch_color
method as added to matplotlib.backend_bases.GraphicsContextBase.
This is only used during the render process in the backends we ship so
will not break any third-party backends.
If you maintain a third-party backend which extends
GraphicsContextBase this method is now
available to you and should be used to color hatch patterns.