Version 3.1.3
Table of Contents
Note
matplotlib 1.1 supports Python 2.4 to 2.7
Kevin Davies has extended Yannick Copin's original Sankey example into a module
(sankey) and provided new examples
(The Sankey class,
Long chain of connections using Sankey,
Rankine power cycle).
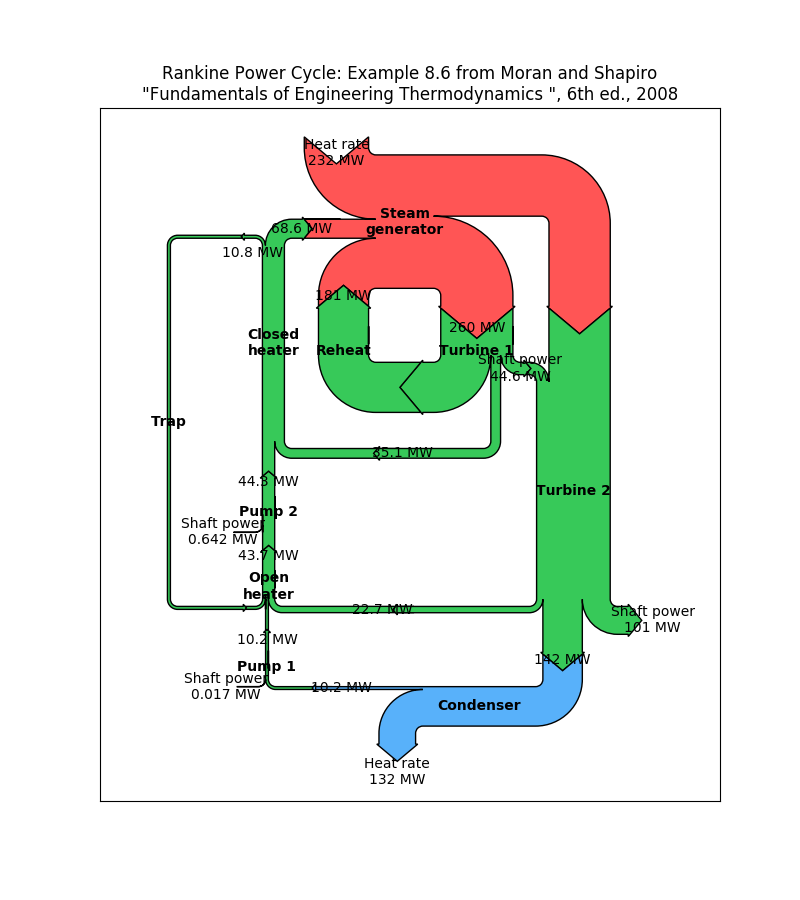
Sankey Rankine
Ryan May has written a backend-independent framework for creating
animated figures. The animation module is intended
to replace the backend-specific examples formerly in the
Gallery listings. Examples using the new framework are
in Animation; see the entrancing double
pendulum <gallery/animation/double_pendulum_sgskip.py> which uses
matplotlib.animation.Animation.save() to create the movie below.
This should be considered as a beta release of the framework; please try it and provide feedback.
A frequent issue raised by users of matplotlib is the lack of a layout
engine to nicely space out elements of the plots. While matplotlib still
adheres to the philosophy of giving users complete control over the placement
of plot elements, Jae-Joon Lee created the tight_layout
module and introduced a new
command tight_layout()
to address the most common layout issues.
(Source code, png, pdf)
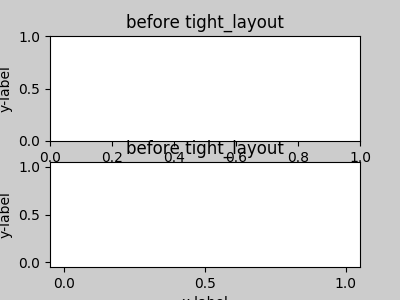
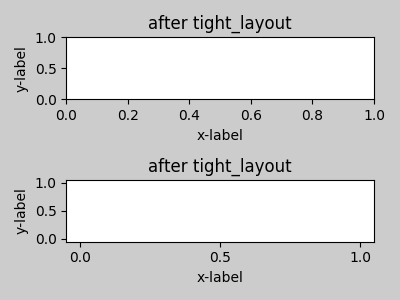
The usage of this functionality can be as simple as
plt.tight_layout()
and it will adjust the spacing between subplots so that the axis labels do not overlap with neighboring subplots. A Tight Layout guide has been created to show how to use this new tool.
Gerald Storer made the Qt4 backend compatible with PySide as well as PyQT4. At present, however, PySide does not support the PyOS_InputHook mechanism for handling gui events while waiting for text input, so it cannot be used with the new version 0.11 of IPython. Until this feature appears in PySide, IPython users should use the PyQT4 wrapper for QT4, which remains the matplotlib default.
An rcParam entry, "backend.qt4", has been added to allow users to select PyQt4, PyQt4v2, or PySide. The latter two use the Version 2 Qt API. In most cases, users can ignore this rcParam variable; it is available to aid in testing, and to provide control for users who are embedding matplotlib in a PyQt4 or PySide app.
Jae-Joon Lee has improved plot legends. First,
legends for complex plots such as stem() plots
will now display correctly. Second, the 'best' placement of a legend has
been improved in the presence of NANs.
See the Legend guide for more detailed explanation and examples.
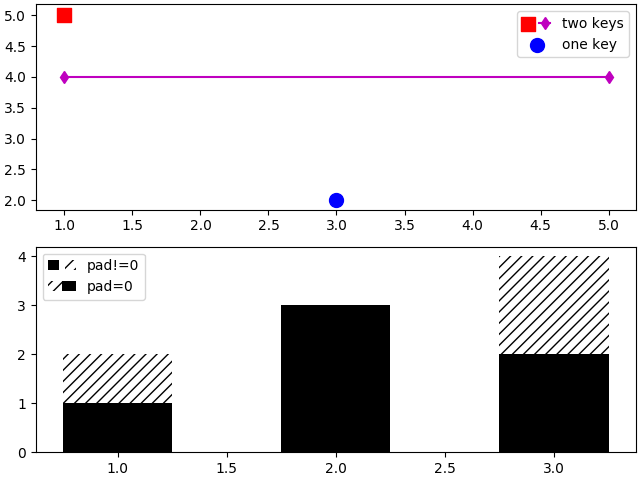
Legend Demo4
In continuing the efforts to make 3D plotting in matplotlib just as easy
as 2D plotting, Ben Root has made several improvements to the
mplot3d module.
Axes3D has been
improved to bring the class towards feature-parity with regular
Axes objects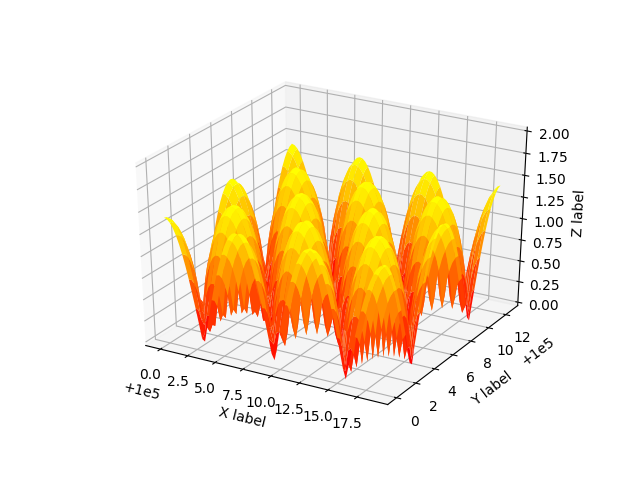
Offset
contourf()
gains zdir and offset kwargs. You can now do this: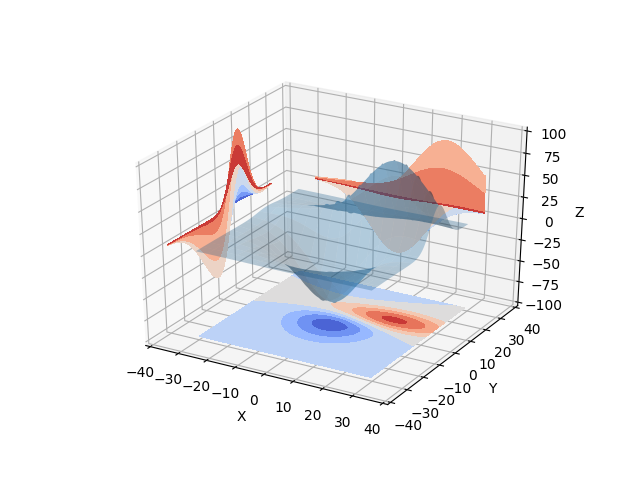
Contourf3d 2
After more than two years of deprecation warnings, Numerix support has now been completely removed from matplotlib.
The list of available markers for plot() and
scatter() has now been merged. While they
were mostly similar, some markers existed for one function, but not
the other. This merge did result in a conflict for the 'd' diamond
marker. Now, 'd' will be interpreted to always mean "thin" diamond
while 'D' will mean "regular" diamond.
Thanks to Michael Droettboom for this effort.
arrow()PolarAxes gains getters and setters for
"theta_direction", and "theta_offset" to allow for theta to go in
either the clock-wise or counter-clockwise direction and to specify where zero
degrees should be placed.
set_theta_zero_location() is an
added convenience function.tripcolor()axes.labelweight parameter added to rcParams.imshow(), interpolation='nearest' will
now always perform an interpolation. A "none" option has been added to
indicate no interpolation at all.contour() now accepts a callable.
Thanks to Daniel Hyams for the original patch.HBox
and VBox classes.imshow().scatter() now accepts empty inputs.figure().