Version 3.1.3
Table of Contents
Jae-Joon Lee has written two new guides Legend guide and Advanced Annotation. Michael Sarahan has written Image tutorial. John Hunter has written two new tutorials on working with paths and transformations: Path Tutorial and Transformations Tutorial.
Reinier Heeres has ported John Porter's mplot3d over to the new matplotlib transformations framework, and it is now available as a toolkit mpl_toolkits.mplot3d (which now comes standard with all mpl installs). See 3D plotting and Getting started
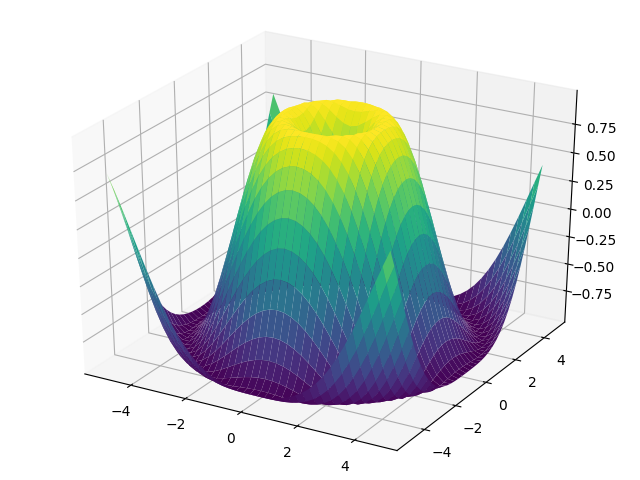
Whats New 99 Mplot3d
Jae-Joon Lee has added a new toolkit to ease displaying multiple images in matplotlib, as well as some support for curvilinear grids to support the world coordinate system. The toolkit is included standard with all new mpl installs. See Axes Grid, Axis Artist, What is axes_grid1 toolkit? and axisartist
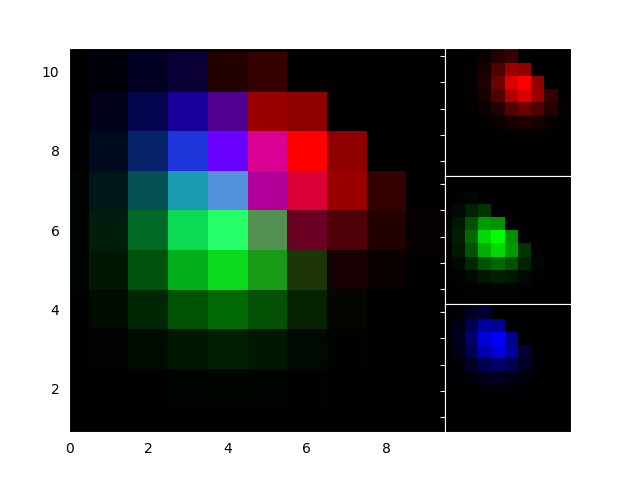
Whats New 99 Axes Grid
Andrew Straw has added the ability to place "axis spines" -- the lines
that denote the data limits -- in various arbitrary locations. No
longer are your axis lines constrained to be a simple rectangle around
the figure -- you can turn on or off left, bottom, right and top, as
well as "detach" the spine to offset it away from the data. See
Spine Placement Demo and
matplotlib.spines.Spine.
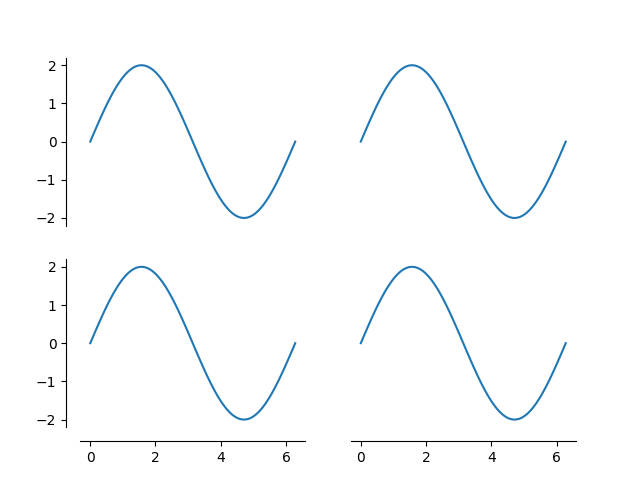
Whats New 99 Spines