Version 3.1.3
Note
Click here to download the full example code
imshow¶imshow() allows you to render an image (either a 2D array
which will be color-mapped (based on norm and cmap) or and 3D RGB(A)
array which will be used as-is) to a rectangular region in dataspace.
The orientation of the image in the final rendering is controlled by
the origin and extent kwargs (and attributes on the resulting
AxesImage instance) and the data limits of the axes.
The extent kwarg controls the bounding box in data coordinates that
the image will fill specified as (left, right, bottom, top) in
data coordinates, the origin kwarg controls how the image fills
that bounding box, and the orientation in the final rendered image is
also affected by the axes limits.
Hint
Most of the code below is used for adding labels and informative text to the plots. The described effects of origin and extent can be seen in the plots without the need to follow all code details.
For a quick understanding, you may want to skip the code details below and directly continue with the discussion of the results.
import numpy as np
import matplotlib.pyplot as plt
from matplotlib.gridspec import GridSpec


def index_to_coordinate(index, extent, origin):
    """Return the pixel center of an index."""
    left, right, bottom, top = extent

    hshift = 0.5 * np.sign(right - left)
    left, right = left + hshift, right - hshift
    vshift = 0.5 * np.sign(top - bottom)
    bottom, top = bottom + vshift, top - vshift

    if origin == 'upper':
        bottom, top = top, bottom

    return {
        "[0, 0]": (left, bottom),
        "[M', 0]": (left, top),
        "[0, N']": (right, bottom),
        "[M', N']": (right, top),
    }[index]


def get_index_label_pos(index, extent, origin, inverted_xindex):
    """
    Return the desired position and horizontal alignment of an index label.
    """
    if extent is None:
        extent = lookup_extent(origin)
    left, right, bottom, top = extent
    x, y = index_to_coordinate(index, extent, origin)

    is_x0 = index[-2:] == "0]"
    halign = 'left' if is_x0 ^ inverted_xindex else 'right'
    hshift = 0.5 * np.sign(left - right)
    x += hshift * (1 if is_x0 else -1)
    return x, y, halign


def get_color(index, data, cmap):
    """Return the data color of an index."""
    val = {
        "[0, 0]": data[0, 0],
        "[0, N']": data[0, -1],
        "[M', 0]": data[-1, 0],
        "[M', N']": data[-1, -1],
    }[index]
    return cmap(val / data.max())


def lookup_extent(origin):
    """Return extent for label positioning when not given explicitly."""
    if origin == 'lower':
        return (-0.5, 6.5, -0.5, 5.5)
    else:
        return (-0.5, 6.5, 5.5, -0.5)


def set_extent_None_text(ax):
    ax.text(3, 2.5, 'equals\nextent=None', size='large',
            ha='center', va='center', color='w')


def plot_imshow_with_labels(ax, data, extent, origin, xlim, ylim):
    """Actually run ``imshow()`` and add extent and index labels."""
    im = ax.imshow(data, origin=origin, extent=extent)

    # extent labels (left, right, bottom, top)
    left, right, bottom, top = im.get_extent()
    if xlim is None or top > bottom:
        upper_string, lower_string = 'top', 'bottom'
    else:
        upper_string, lower_string = 'bottom', 'top'
    if ylim is None or left < right:
        port_string, starboard_string = 'left', 'right'
        inverted_xindex = False
    else:
        port_string, starboard_string = 'right', 'left'
        inverted_xindex = True
    bbox_kwargs = {'fc': 'w', 'alpha': .75, 'boxstyle': "round4"}
    ann_kwargs = {'xycoords': 'axes fraction',
                  'textcoords': 'offset points',
                  'bbox': bbox_kwargs}
    ax.annotate(upper_string, xy=(.5, 1), xytext=(0, -1),
                ha='center', va='top', **ann_kwargs)
    ax.annotate(lower_string, xy=(.5, 0), xytext=(0, 1),
                ha='center', va='bottom', **ann_kwargs)
    ax.annotate(port_string, xy=(0, .5), xytext=(1, 0),
                ha='left', va='center', rotation=90,
                **ann_kwargs)
    ax.annotate(starboard_string, xy=(1, .5), xytext=(-1, 0),
                ha='right', va='center', rotation=-90,
                **ann_kwargs)
    ax.set_title('origin: {origin}'.format(origin=origin))

    # index labels
    for index in ["[0, 0]", "[0, N']", "[M', 0]", "[M', N']"]:
        tx, ty, halign = get_index_label_pos(index, extent, origin,
                                             inverted_xindex)
        facecolor = get_color(index, data, im.get_cmap())
        ax.text(tx, ty, index, color='white', ha=halign, va='center',
                bbox={'boxstyle': 'square', 'facecolor': facecolor})
    if xlim:
        ax.set_xlim(*xlim)
    if ylim:
        ax.set_ylim(*ylim)


def generate_imshow_demo_grid(extents, xlim=None, ylim=None):
    N = len(extents)
    fig = plt.figure(tight_layout=True)
    fig.set_size_inches(6, N * (11.25) / 5)
    gs = GridSpec(N, 5, figure=fig)

    columns = {'label': [fig.add_subplot(gs[j, 0]) for j in range(N)],
               'upper': [fig.add_subplot(gs[j, 1:3]) for j in range(N)],
               'lower': [fig.add_subplot(gs[j, 3:5]) for j in range(N)]}
    x, y = np.ogrid[0:6, 0:7]
    data = x + y

    for origin in ['upper', 'lower']:
        for ax, extent in zip(columns[origin], extents):
            plot_imshow_with_labels(ax, data, extent, origin, xlim, ylim)

    for ax, extent in zip(columns['label'], extents):
        text_kwargs = {'ha': 'right',
                       'va': 'center',
                       'xycoords': 'axes fraction',
                       'xy': (1, .5)}
        if extent is None:
            ax.annotate('None', **text_kwargs)
            ax.set_title('extent=')
        else:
            left, right, bottom, top = extent
            text = ('left: {left:0.1f}\nright: {right:0.1f}\n' +
                    'bottom: {bottom:0.1f}\ntop: {top:0.1f}\n').format(
                        left=left, right=right, bottom=bottom, top=top)

            ax.annotate(text, **text_kwargs)
        ax.axis('off')
    return columns
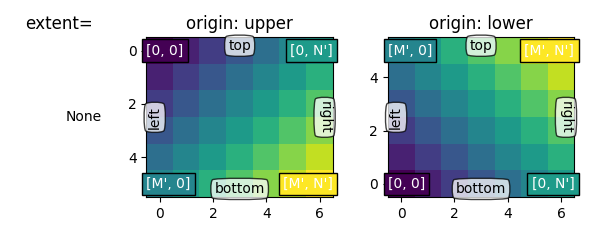
First, let's have a look at the default extent=None
generate_imshow_demo_grid(extents=[None])
Out:
{'label': [<matplotlib.axes._subplots.AxesSubplot object at 0x7f1888f694f0>], 'upper': [<matplotlib.axes._subplots.AxesSubplot object at 0x7f188b73fd60>], 'lower': [<matplotlib.axes._subplots.AxesSubplot object at 0x7f18892c7100>]}
Generally, for an array of shape (M, N), the first index runs along the
vertical, the second index runs along the horizontal.
The pixel centers are at integer positions ranging from 0 to N' = N - 1
horizontally and from 0 to M' = M - 1 vertically.
origin determines how to the data is filled in the bounding box.
For origin='lower':
- [0, 0] is at (left, bottom)
- [M', 0] is at (left, top)
- [0, N'] is at (right, bottom)
- [M', N'] is at (right, top)
origin='upper' reverses the vertical axes direction and filling:
- [0, 0] is at (left, top)
- [M', 0] is at (left, bottom)
- [0, N'] is at (right, top)
- [M', N'] is at (right, bottom)
In summary, the position of the [0, 0] index as well as the extent are influenced by origin:
| origin | [0, 0] position | extent |
|---|---|---|
| upper | top left | (-0.5, numcols-0.5, numrows-0.5, -0.5) |
| lower | bottom left | (-0.5, numcols-0.5, -0.5, numrows-0.5) |
The default value of origin is set by rcParams["image.origin"] (default: 'upper') which defaults
to 'upper' to match the matrix indexing conventions in math and
computer graphics image indexing conventions.
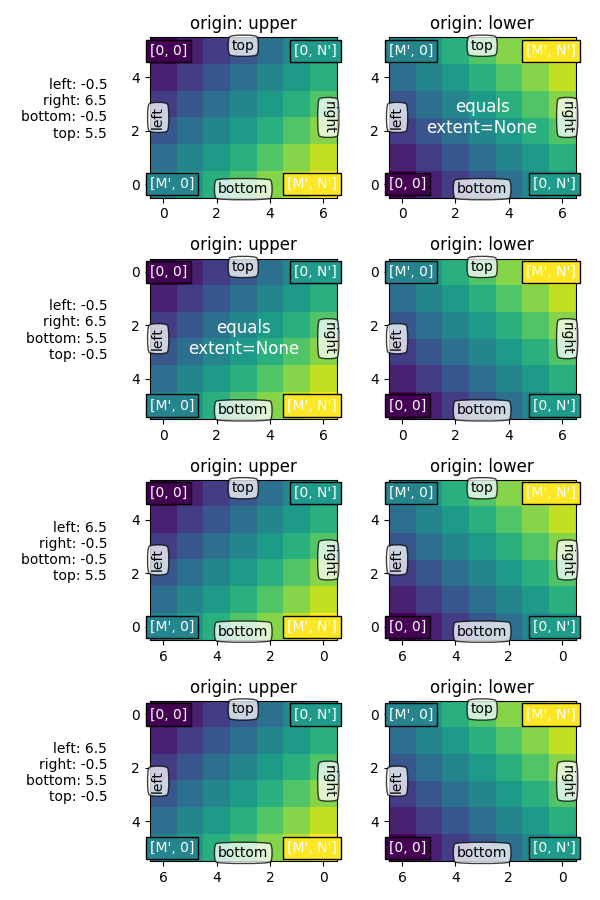
By setting extent we define the coordinates of the image area. The underlying image data is interpolated/resampled to fill that area.
If the axes is set to autoscale, then the view limits of the axes are set
to match the extent which ensures that the coordinate set by
(left, bottom) is at the bottom left of the axes! However, this
may invert the axis so they do not increase in the 'natural' direction.
extents = [(-0.5, 6.5, -0.5, 5.5),
           (-0.5, 6.5, 5.5, -0.5),
           (6.5, -0.5, -0.5, 5.5),
           (6.5, -0.5, 5.5, -0.5)]

columns = generate_imshow_demo_grid(extents)
set_extent_None_text(columns['upper'][1])
set_extent_None_text(columns['lower'][0])
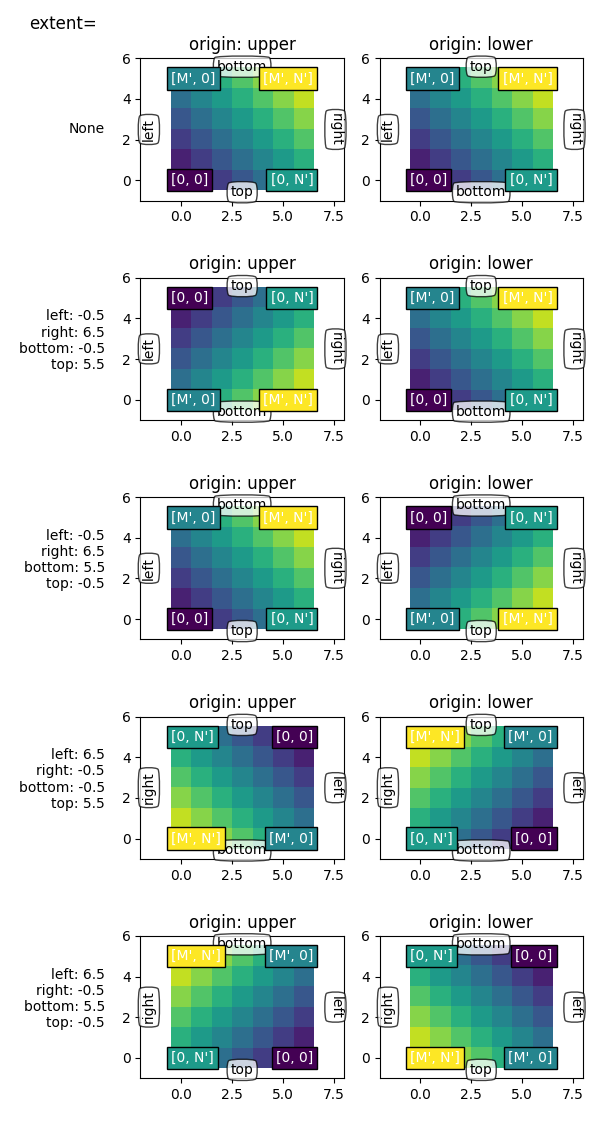
If we fix the axes limits by explicitly setting set_xlim / set_ylim, we
force a certain size and orientation of the axes.
This can decouple the 'left-right' and 'top-bottom' sense of the image from
the orientation on the screen.
In the example below we have chosen the limits slightly larger than the extent (note the white areas within the Axes).
While we keep the extents as in the examples before, the coordinate (0, 0) is now explicitly put at the bottom left and values increase to up and to the right (from the viewer point of view). We can see that:
(left, bottom) anchors the image which then fills the
box going towards the (right, top) point in data space.generate_imshow_demo_grid(extents=[None] + extents,
xlim=(-2, 8), ylim=(-1, 6))
Out:
{'label': [<matplotlib.axes._subplots.AxesSubplot object at 0x7f1887e40d60>, <matplotlib.axes._subplots.AxesSubplot object at 0x7f18884c6a00>, <matplotlib.axes._subplots.AxesSubplot object at 0x7f1888f91c10>, <matplotlib.axes._subplots.AxesSubplot object at 0x7f1889114700>, <matplotlib.axes._subplots.AxesSubplot object at 0x7f1888f30a00>], 'upper': [<matplotlib.axes._subplots.AxesSubplot object at 0x7f188909eb50>, <matplotlib.axes._subplots.AxesSubplot object at 0x7f1889198550>, <matplotlib.axes._subplots.AxesSubplot object at 0x7f1889da7670>, <matplotlib.axes._subplots.AxesSubplot object at 0x7f188134bcd0>, <matplotlib.axes._subplots.AxesSubplot object at 0x7f18894305e0>], 'lower': [<matplotlib.axes._subplots.AxesSubplot object at 0x7f18885ca070>, <matplotlib.axes._subplots.AxesSubplot object at 0x7f18890bb6a0>, <matplotlib.axes._subplots.AxesSubplot object at 0x7f1888f46070>, <matplotlib.axes._subplots.AxesSubplot object at 0x7f188c2b1760>, <matplotlib.axes._subplots.AxesSubplot object at 0x7f188980b130>]}
Total running time of the script: ( 0 minutes 1.017 seconds)
Keywords: matplotlib code example, codex, python plot, pyplot Gallery generated by Sphinx-Gallery