Version 3.1.3
Note
Click here to download the full example code
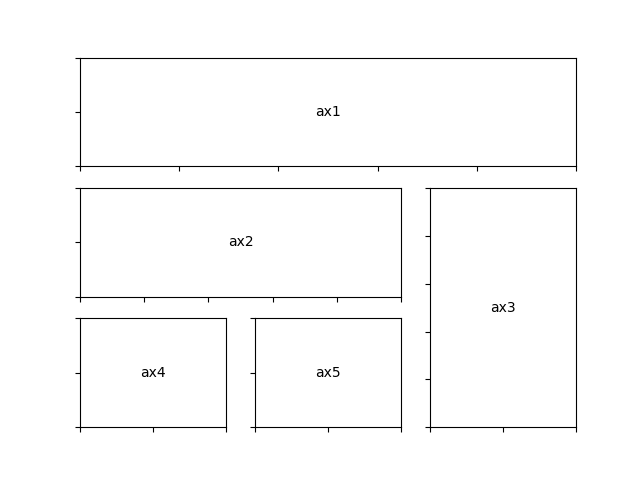
This example demonstrates the use of plt.subplot2grid to generate subplots.
Using GridSpec, as demonstrated in GridSpec demo
is generally preferred.
import matplotlib.pyplot as plt


def annotate_axes(fig):
    for i, ax in enumerate(fig.axes):
        ax.text(0.5, 0.5, "ax%d" % (i+1), va="center", ha="center")
        ax.tick_params(labelbottom=False, labelleft=False)


fig = plt.figure()
ax1 = plt.subplot2grid((3, 3), (0, 0), colspan=3)
ax2 = plt.subplot2grid((3, 3), (1, 0), colspan=2)
ax3 = plt.subplot2grid((3, 3), (1, 2), rowspan=2)
ax4 = plt.subplot2grid((3, 3), (2, 0))
ax5 = plt.subplot2grid((3, 3), (2, 1))

annotate_axes(fig)

plt.show()
Keywords: matplotlib code example, codex, python plot, pyplot Gallery generated by Sphinx-Gallery