Version 3.1.3
Note
Click here to download the full example code
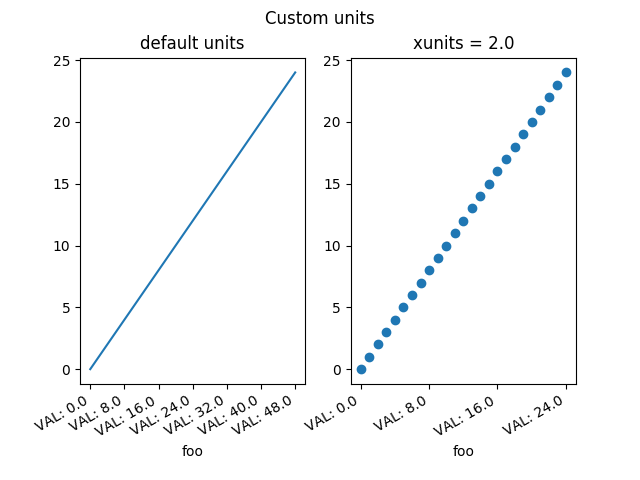
A mockup "Foo" units class which supports conversion and different tick formatting depending on the "unit". Here the "unit" is just a scalar conversion factor, but this example shows that Matplotlib is entirely agnostic to what kind of units client packages use.
import numpy as np

import matplotlib.units as units
import matplotlib.ticker as ticker
import matplotlib.pyplot as plt


class Foo(object):
    def __init__(self, val, unit=1.0):
        self.unit = unit
        self._val = val * unit

    def value(self, unit):
        if unit is None:
            unit = self.unit
        return self._val / unit


class FooConverter(units.ConversionInterface):
    @staticmethod
    def axisinfo(unit, axis):
        'return the Foo AxisInfo'
        if unit == 1.0 or unit == 2.0:
            return units.AxisInfo(
                majloc=ticker.IndexLocator(8, 0),
                majfmt=ticker.FormatStrFormatter("VAL: %s"),
                label='foo',
                )

        else:
            return None

    @staticmethod
    def convert(obj, unit, axis):
        """
        convert obj using unit.  If obj is a sequence, return the
        converted sequence
        """
        if units.ConversionInterface.is_numlike(obj):
            return obj

        if np.iterable(obj):
            return [o.value(unit) for o in obj]
        else:
            return obj.value(unit)

    @staticmethod
    def default_units(x, axis):
        'return the default unit for x or None'
        if np.iterable(x):
            for thisx in x:
                return thisx.unit
        else:
            return x.unit


units.registry[Foo] = FooConverter()

# create some Foos
x = []
for val in range(0, 50, 2):
    x.append(Foo(val, 1.0))

# and some arbitrary y data
y = [i for i in range(len(x))]


fig, (ax1, ax2) = plt.subplots(1, 2)
fig.suptitle("Custom units")
fig.subplots_adjust(bottom=0.2)

# plot specifying units
ax2.plot(x, y, 'o', xunits=2.0)
ax2.set_title("xunits = 2.0")
plt.setp(ax2.get_xticklabels(), rotation=30, ha='right')

# plot without specifying units; will use the None branch for axisinfo
ax1.plot(x, y)  # uses default units
ax1.set_title('default units')
plt.setp(ax1.get_xticklabels(), rotation=30, ha='right')

plt.show()
Keywords: matplotlib code example, codex, python plot, pyplot Gallery generated by Sphinx-Gallery