Version 3.1.3
Note
Click here to download the full example code
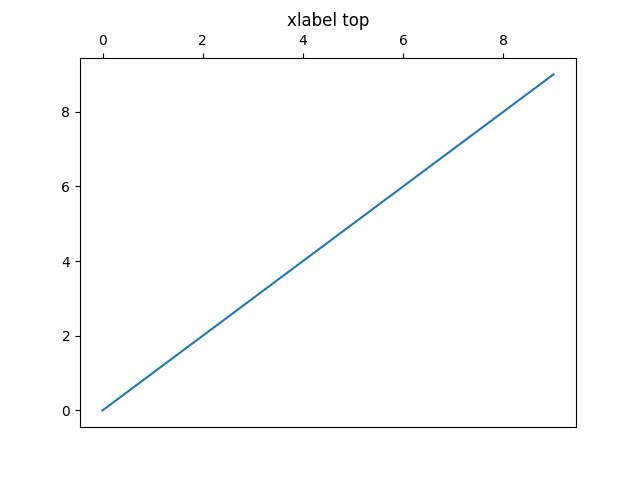
We can use rcParams["xtick.labeltop"] (default: False) (default False) and rcParams["xtick.top"] (default: False)
(default False) and rcParams["xtick.labelbottom"] (default: True) (default True) and
rcParams["xtick.bottom"] (default: True) (default True) to control where on the axes ticks and
their labels appear.
These properties can also be set in .matplotlib/matplotlibrc.
import matplotlib.pyplot as plt
import numpy as np


plt.rcParams['xtick.bottom'] = plt.rcParams['xtick.labelbottom'] = False
plt.rcParams['xtick.top'] = plt.rcParams['xtick.labeltop'] = True

x = np.arange(10)

fig, ax = plt.subplots()

ax.plot(x)
ax.set_title('xlabel top')  # Note title moves to make room for ticks

plt.show()
Keywords: matplotlib code example, codex, python plot, pyplot Gallery generated by Sphinx-Gallery